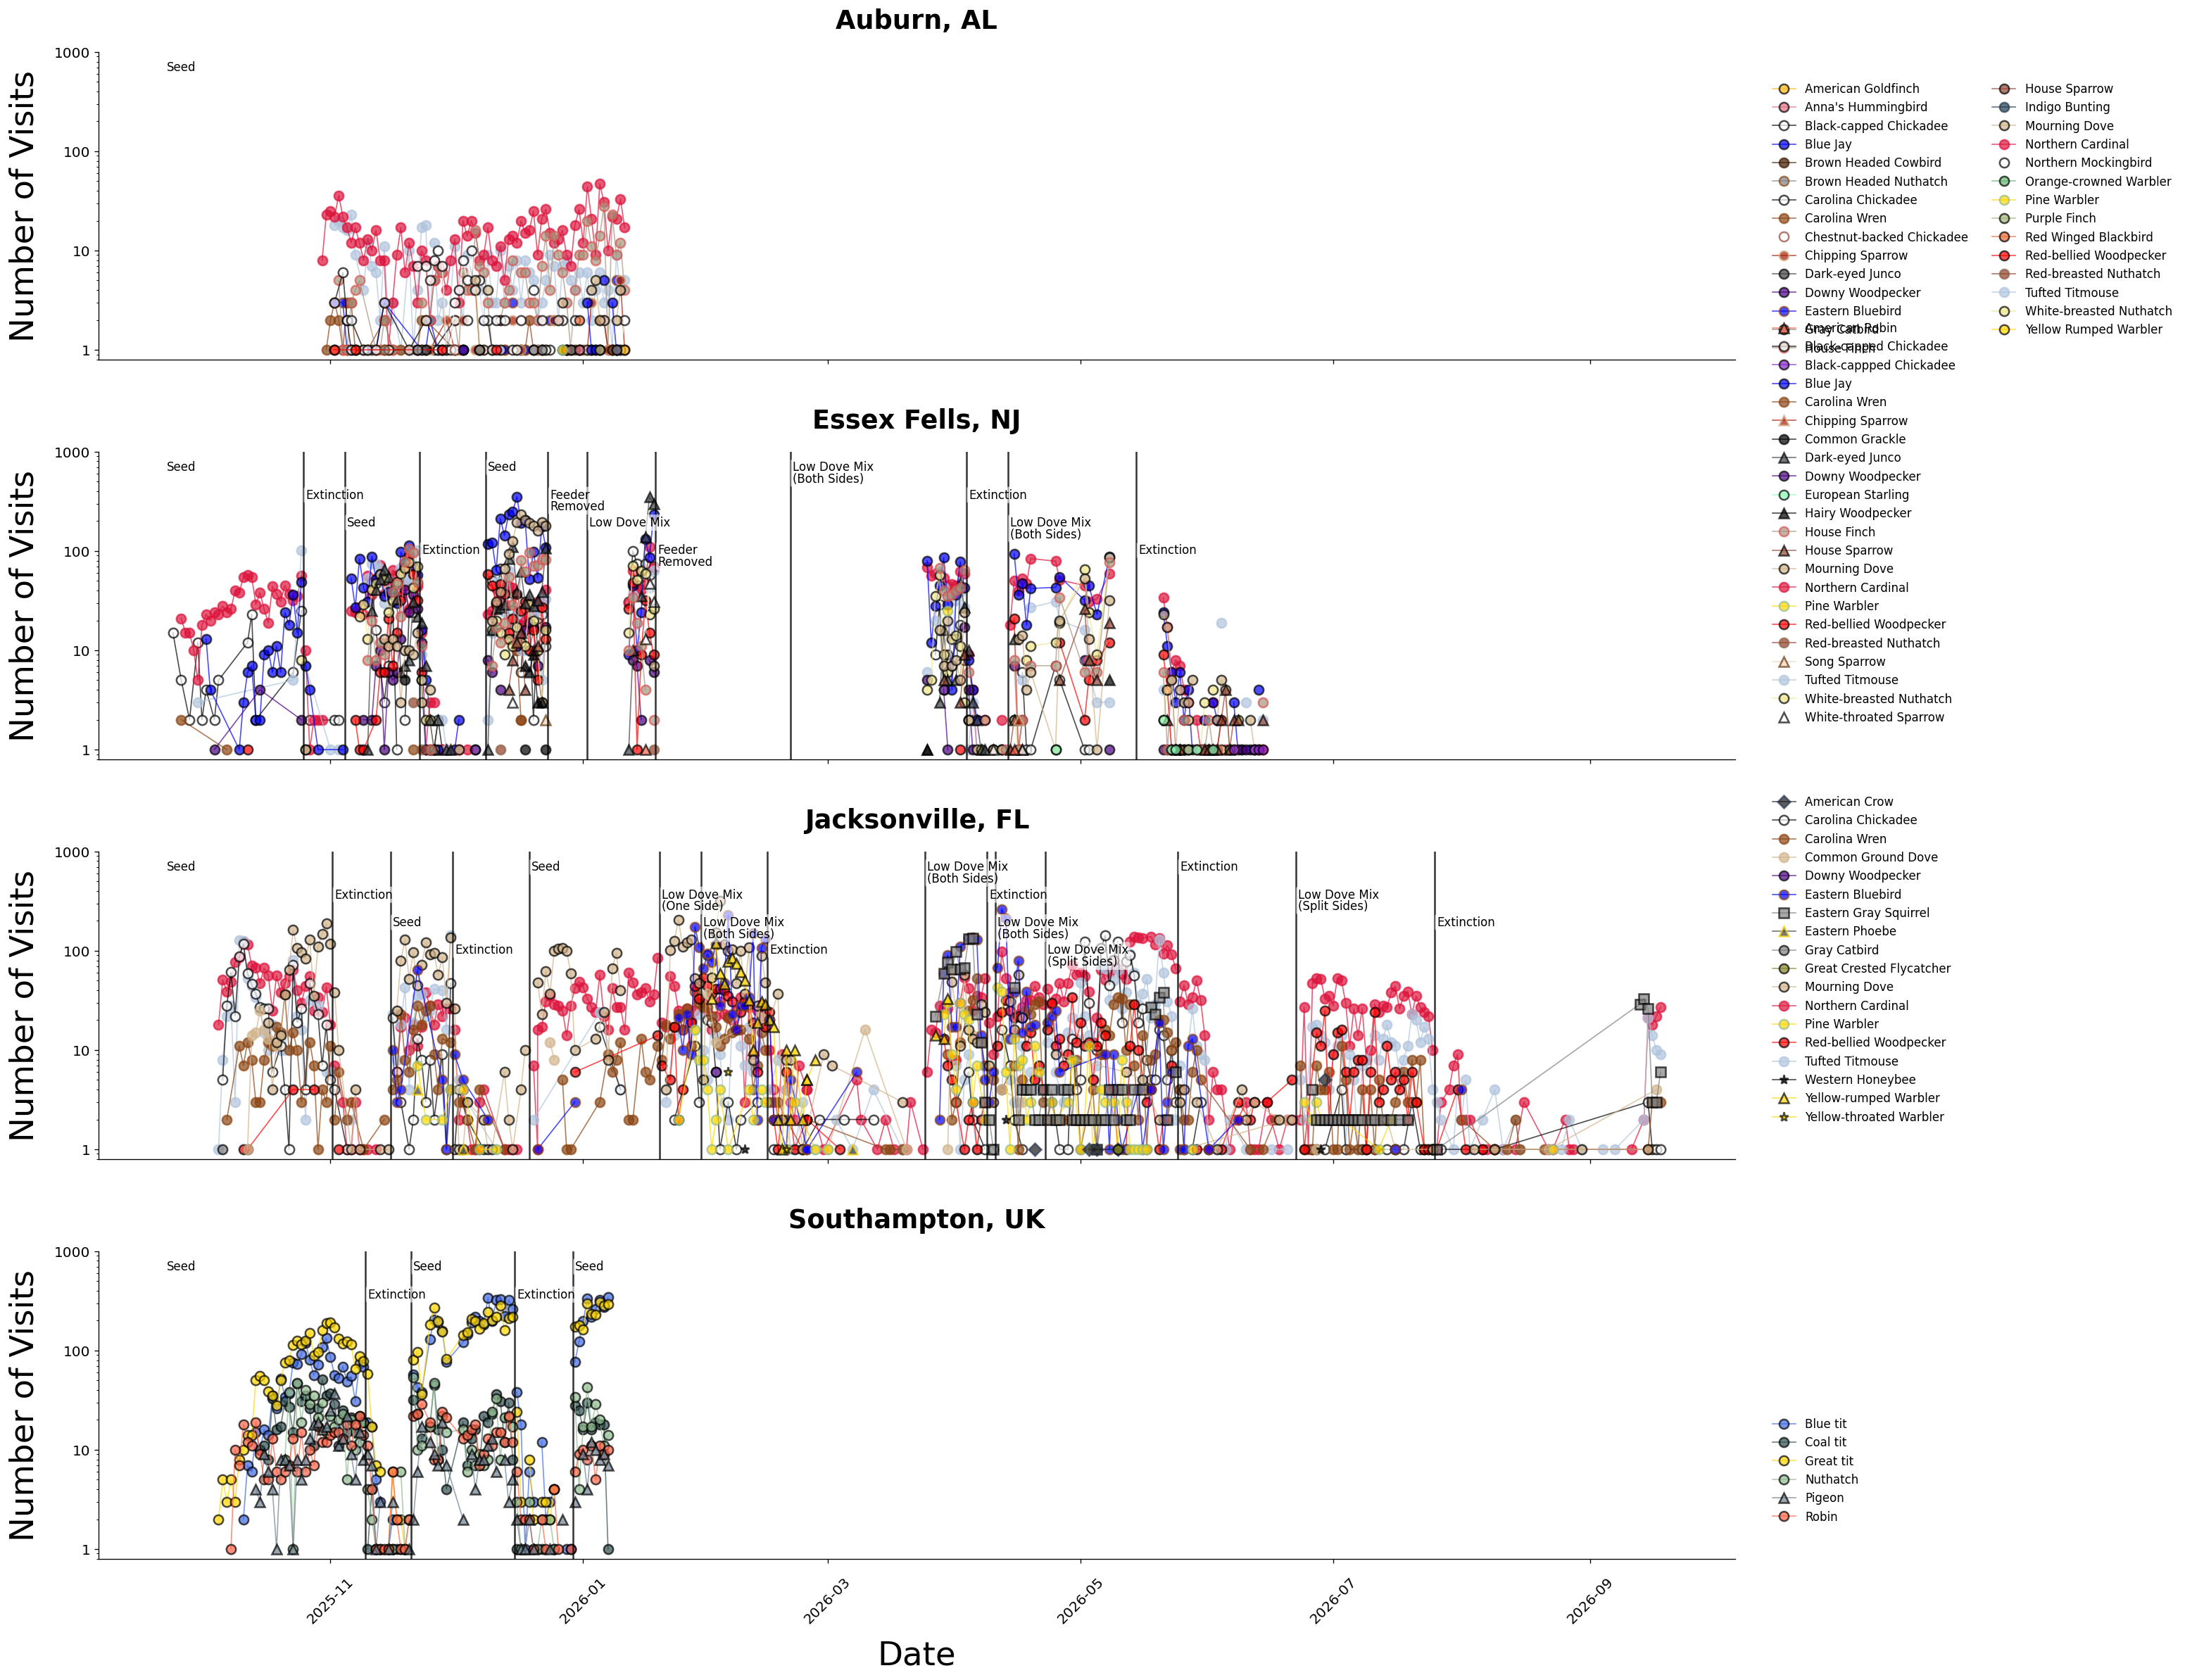
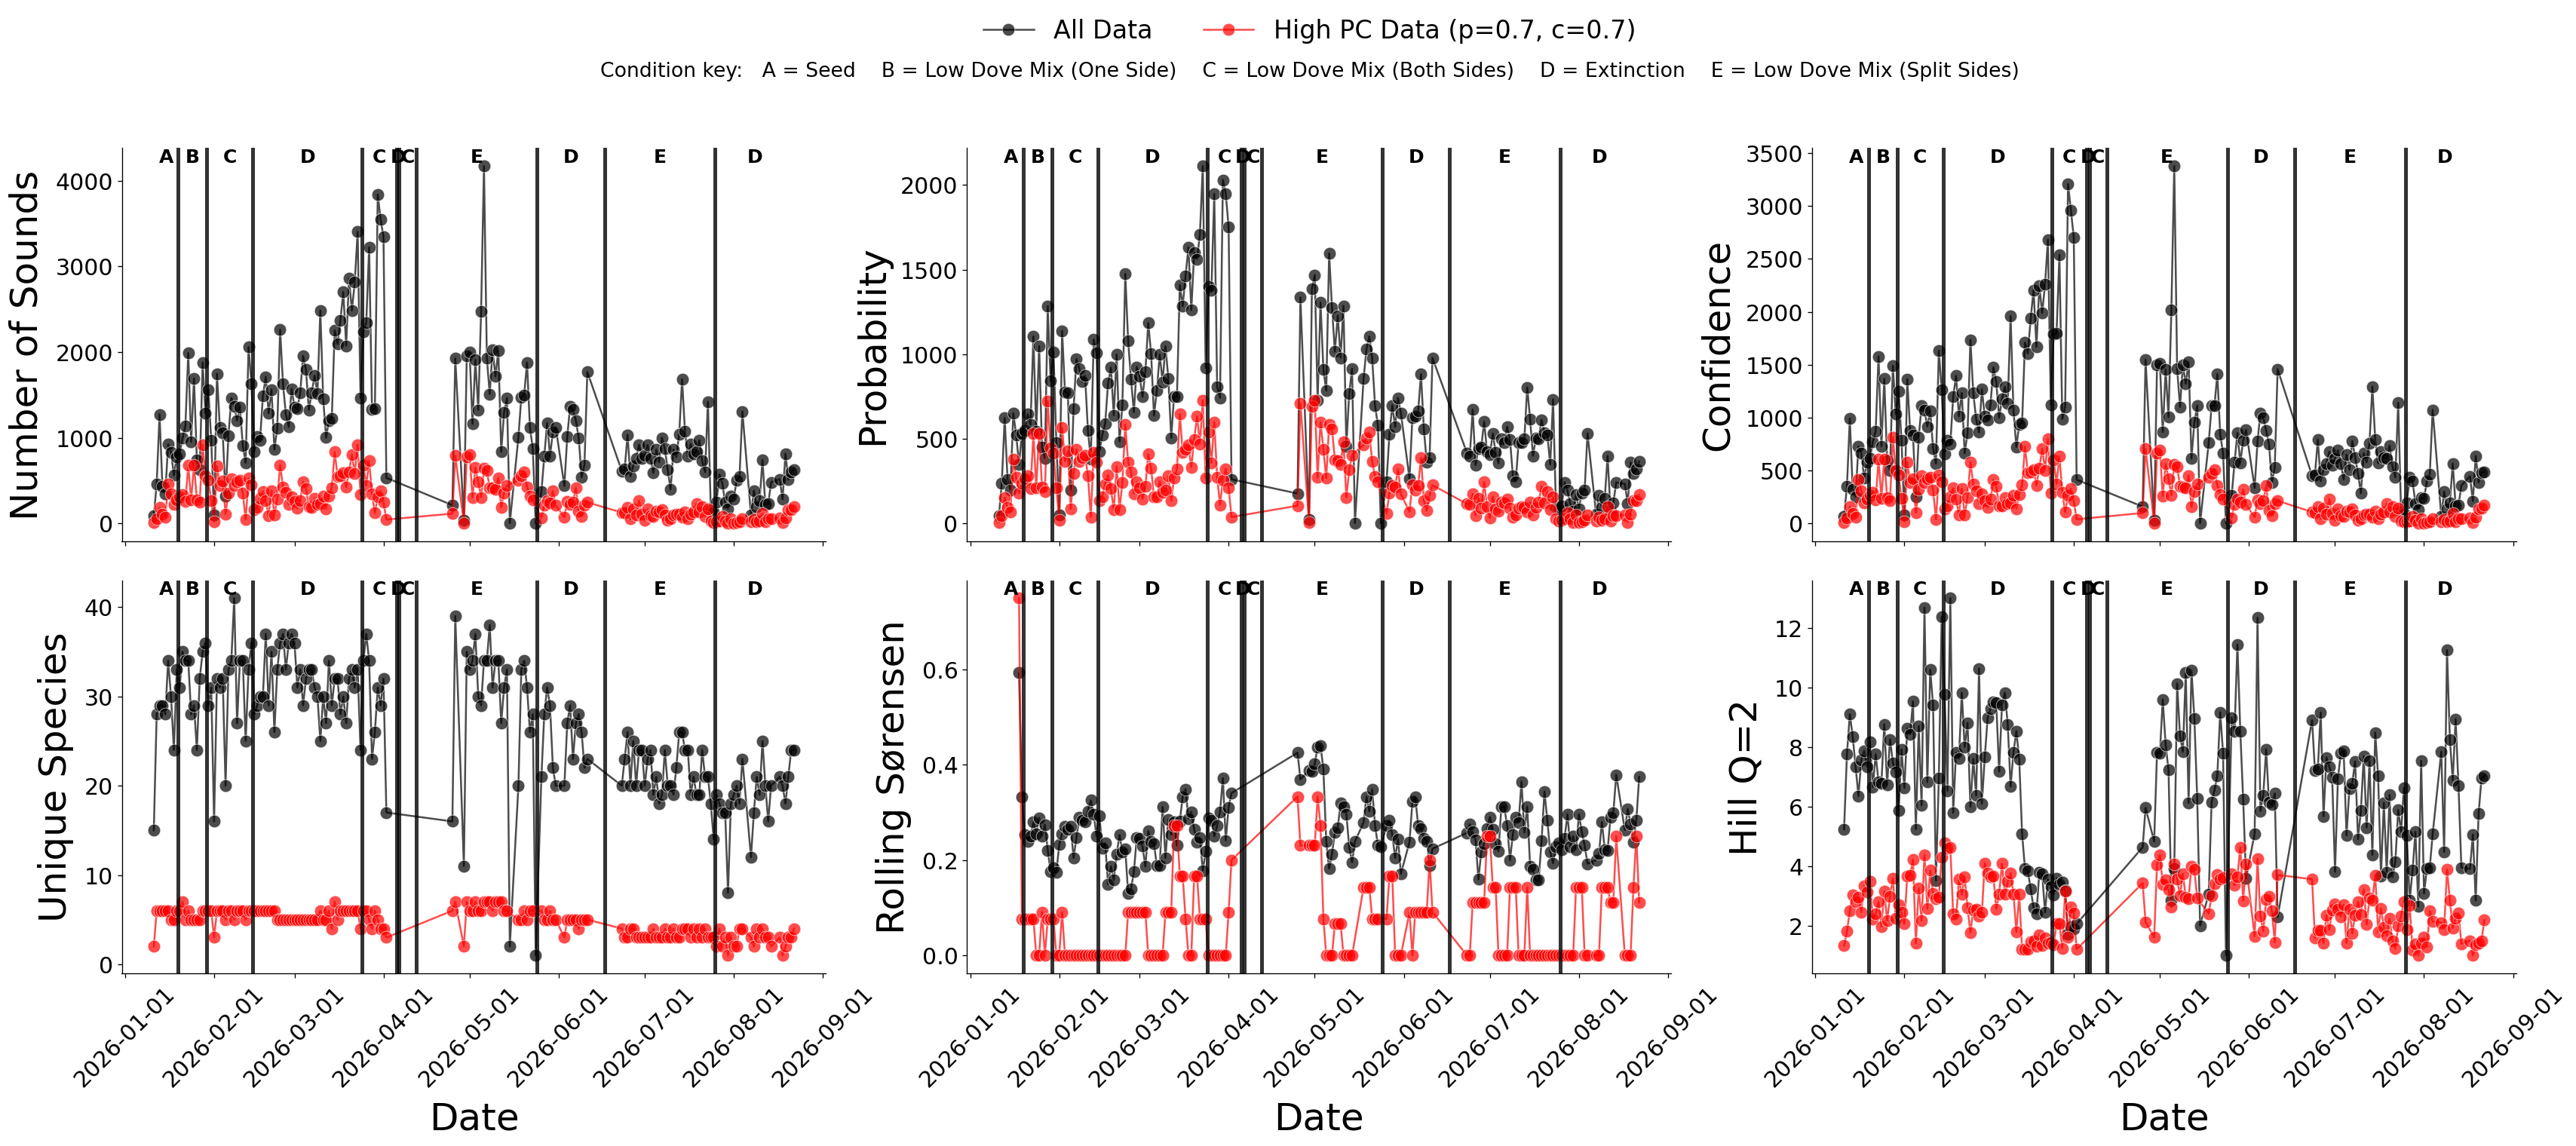
Daily Bird Feeder Visits by Species
Type: Static Plot
Created: 2026-10-23T15:55:17.095342
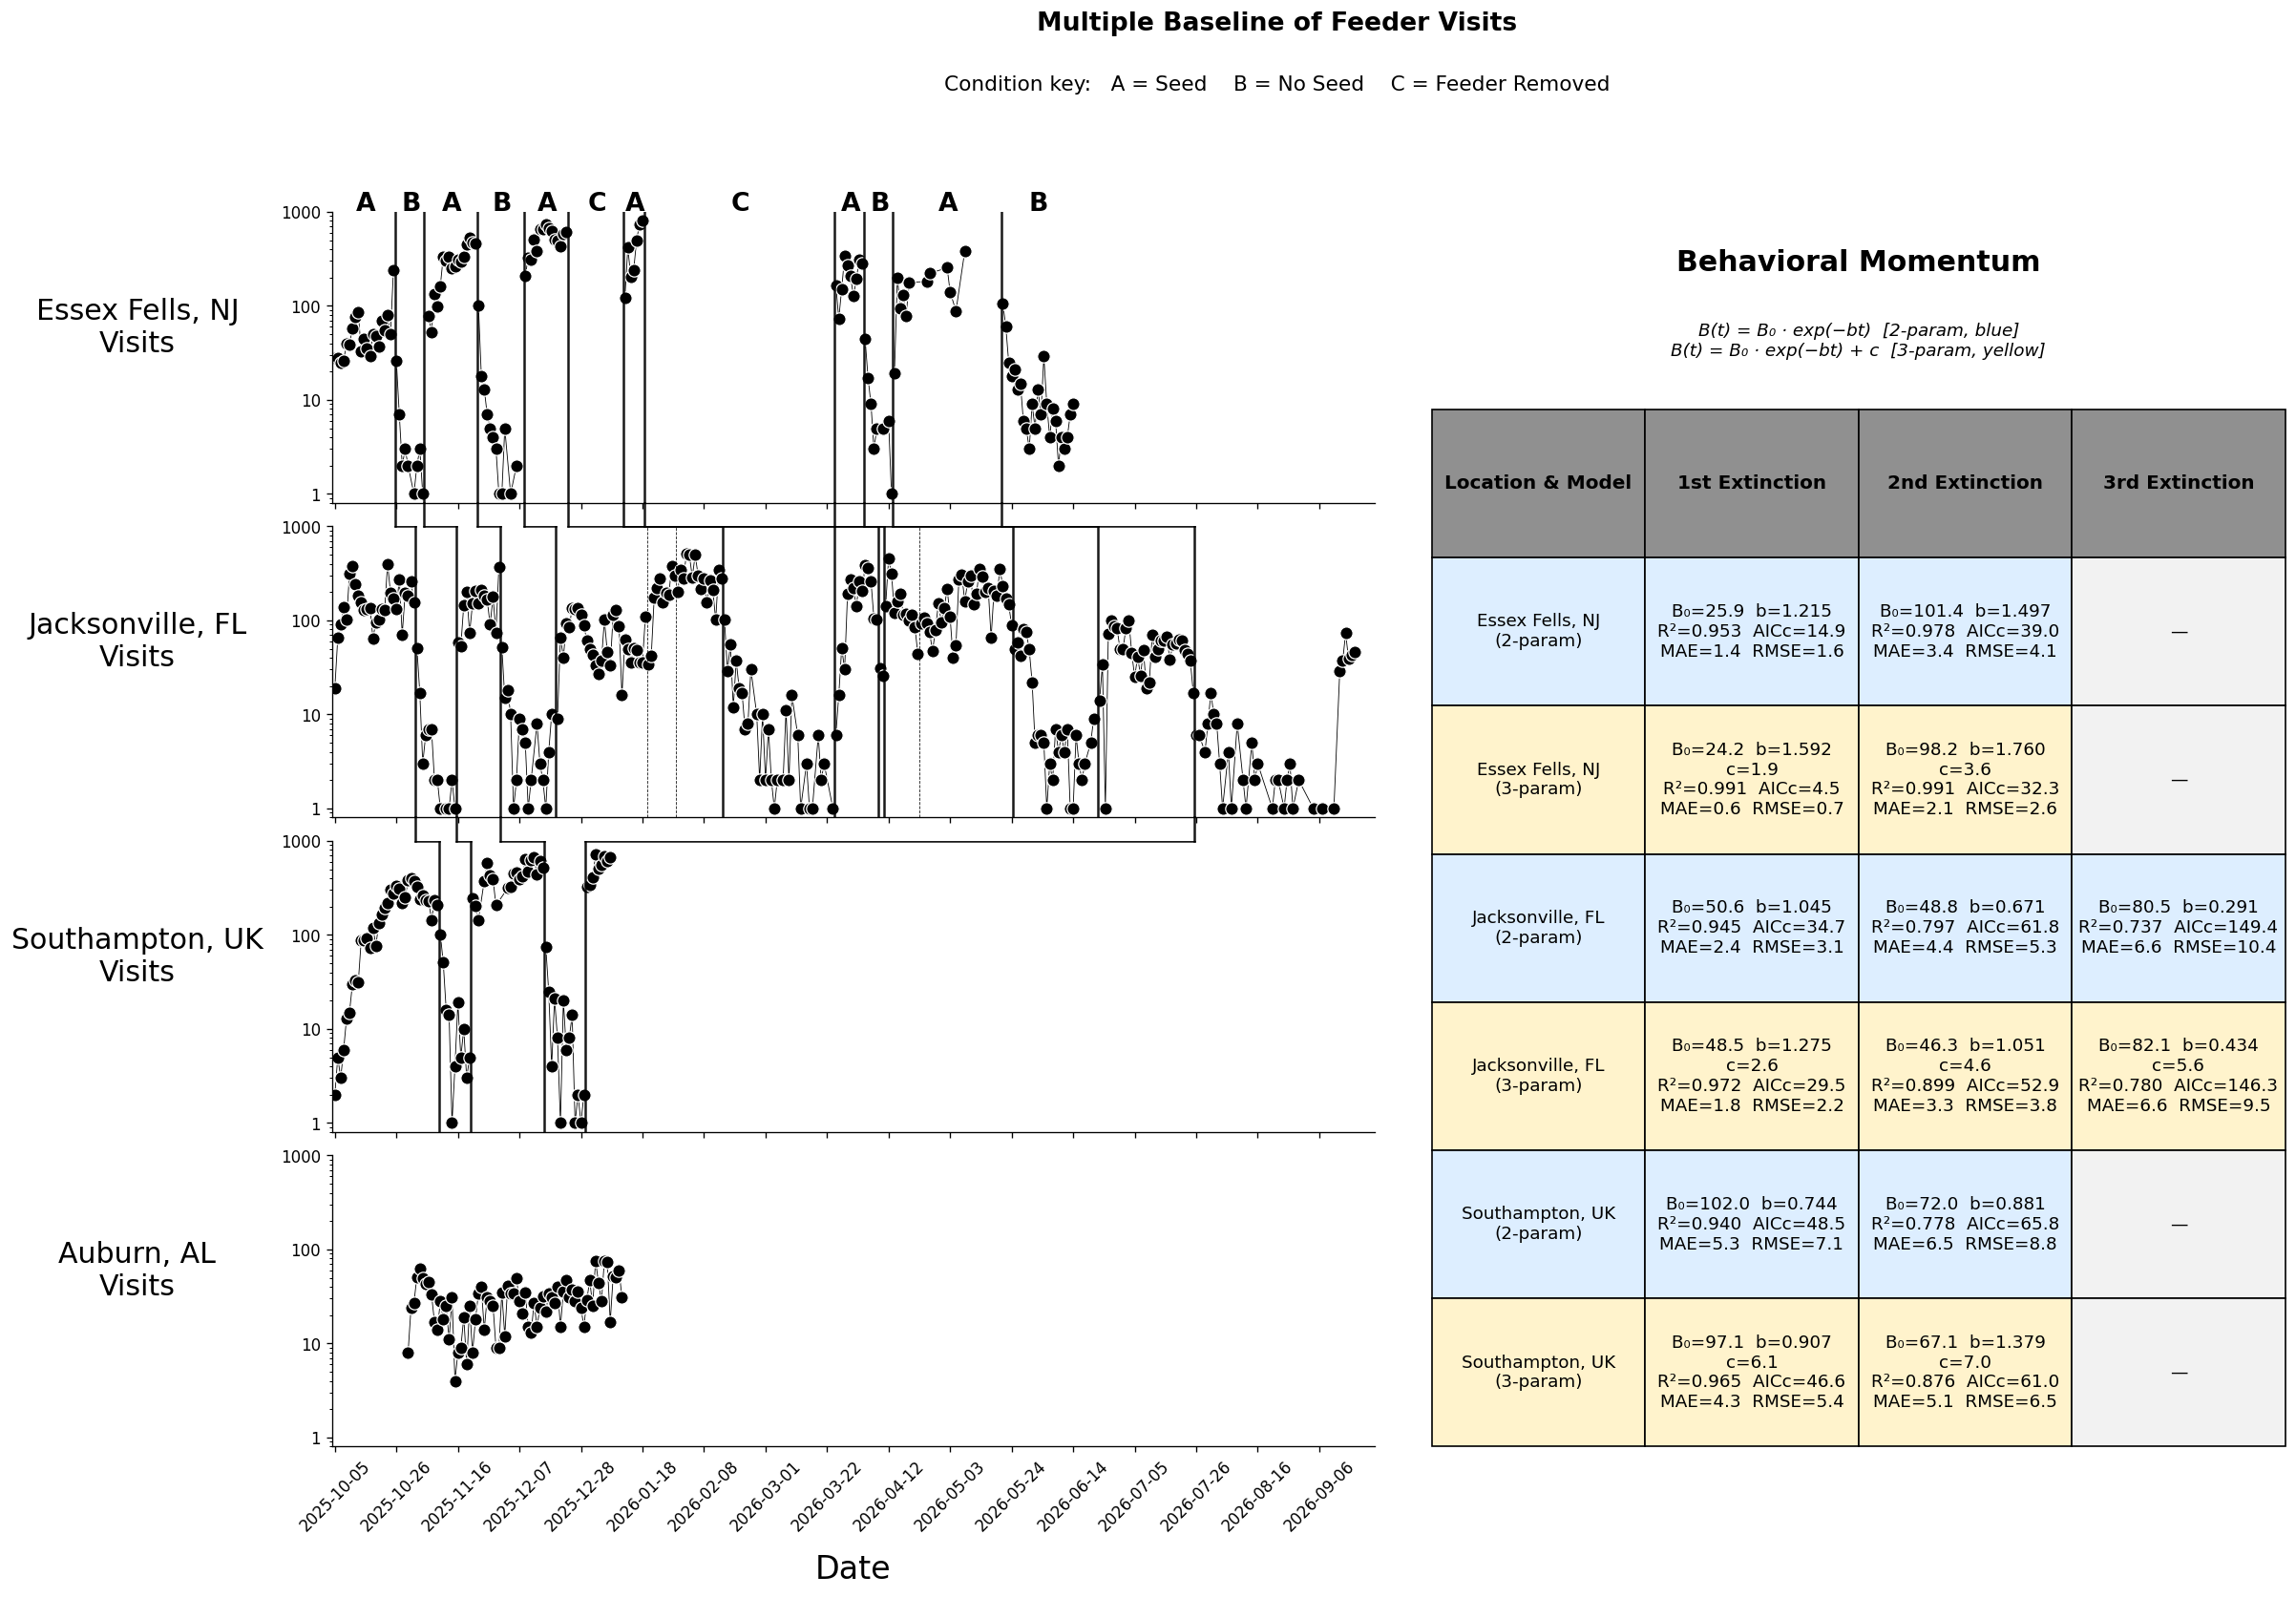
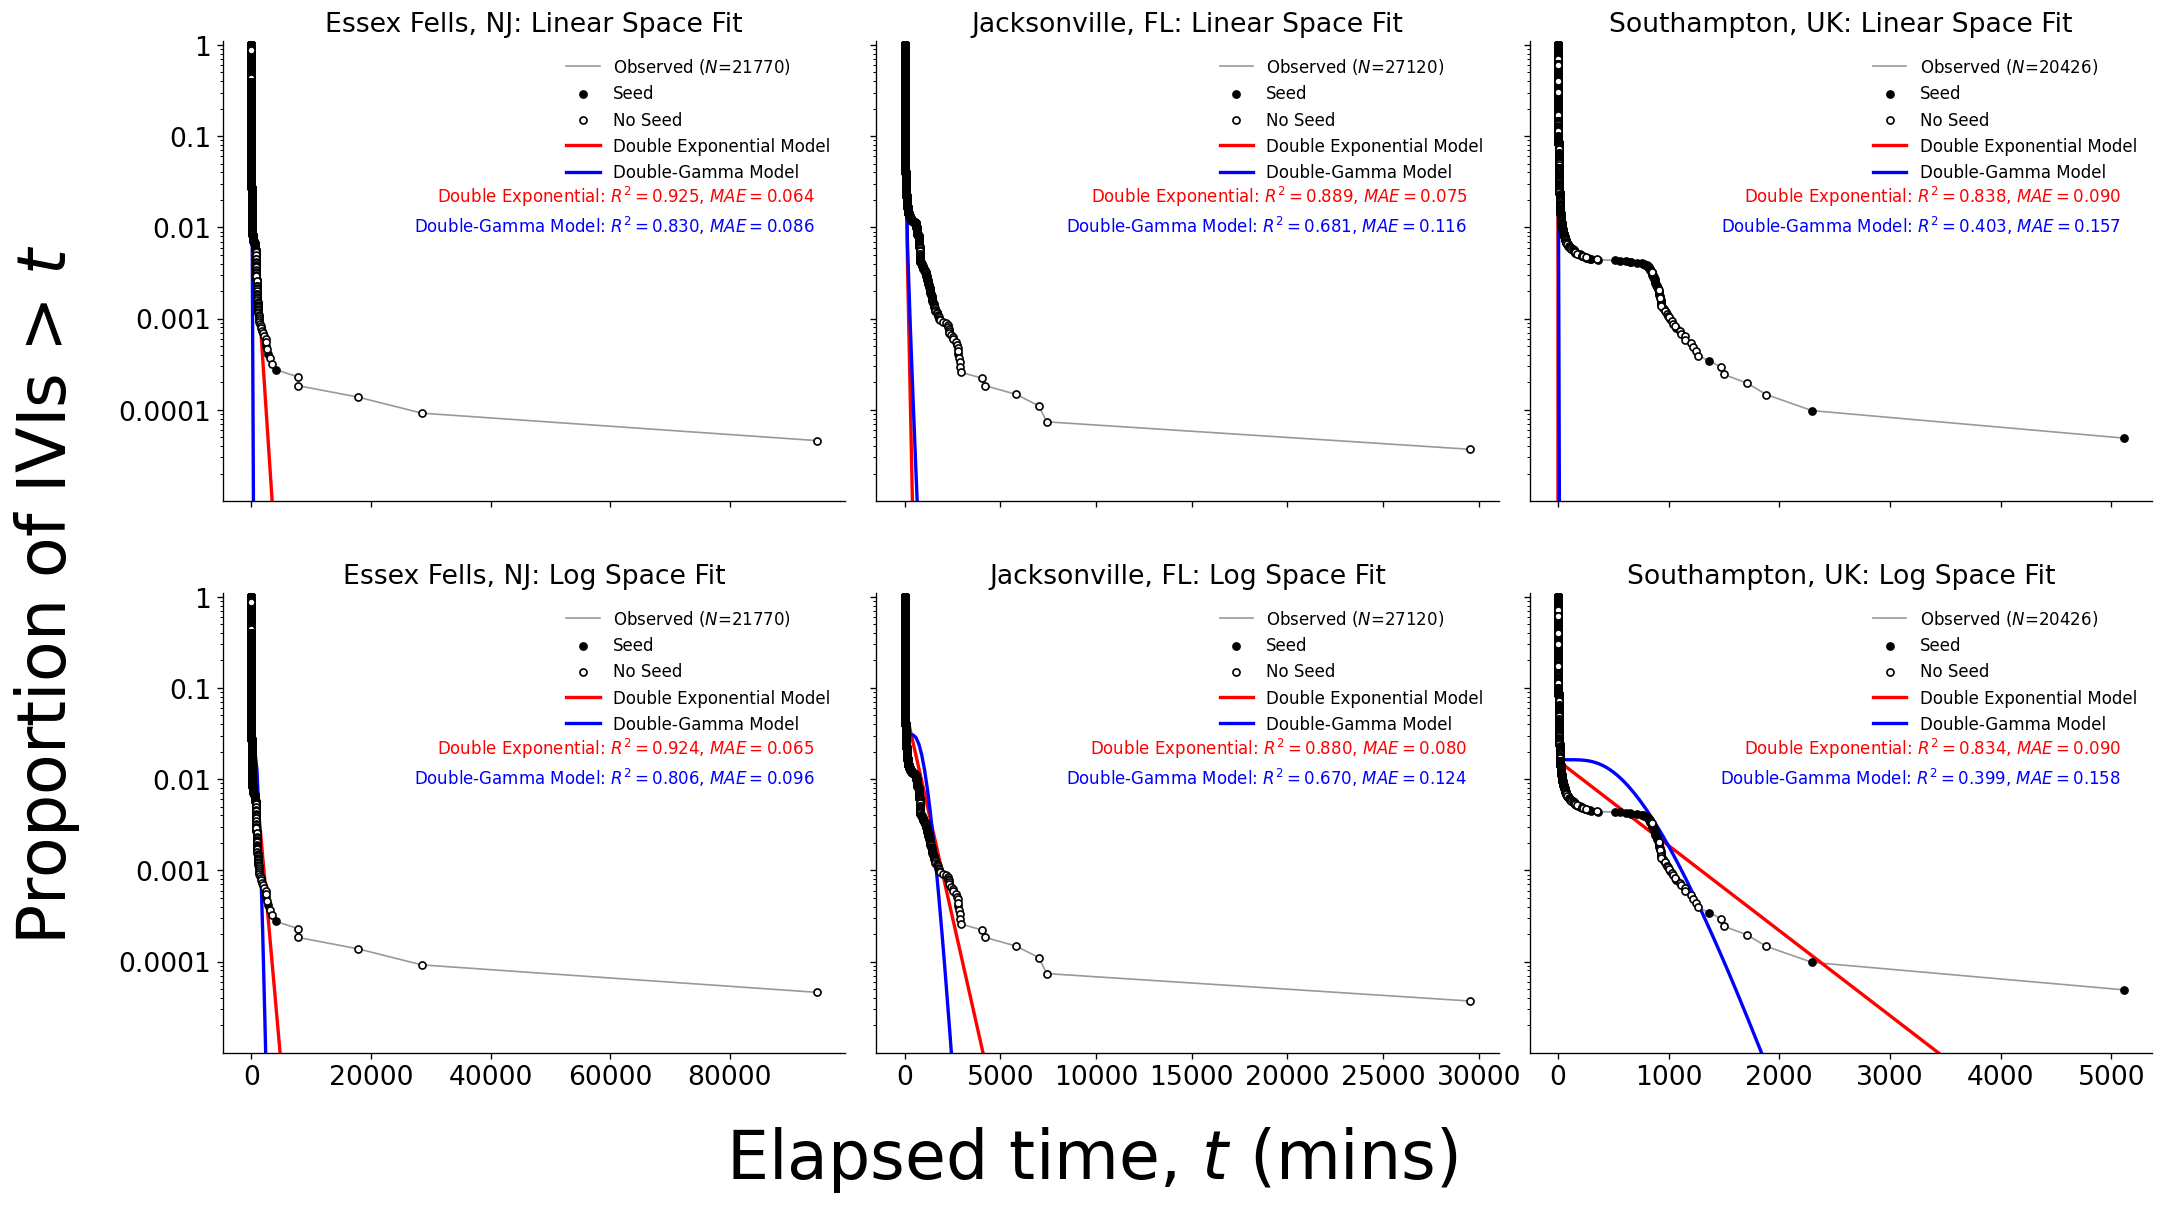
Multiple Baseline of Feeder Visits
Type: Static Plot
Created: 2026-10-23T15:56:38.868504
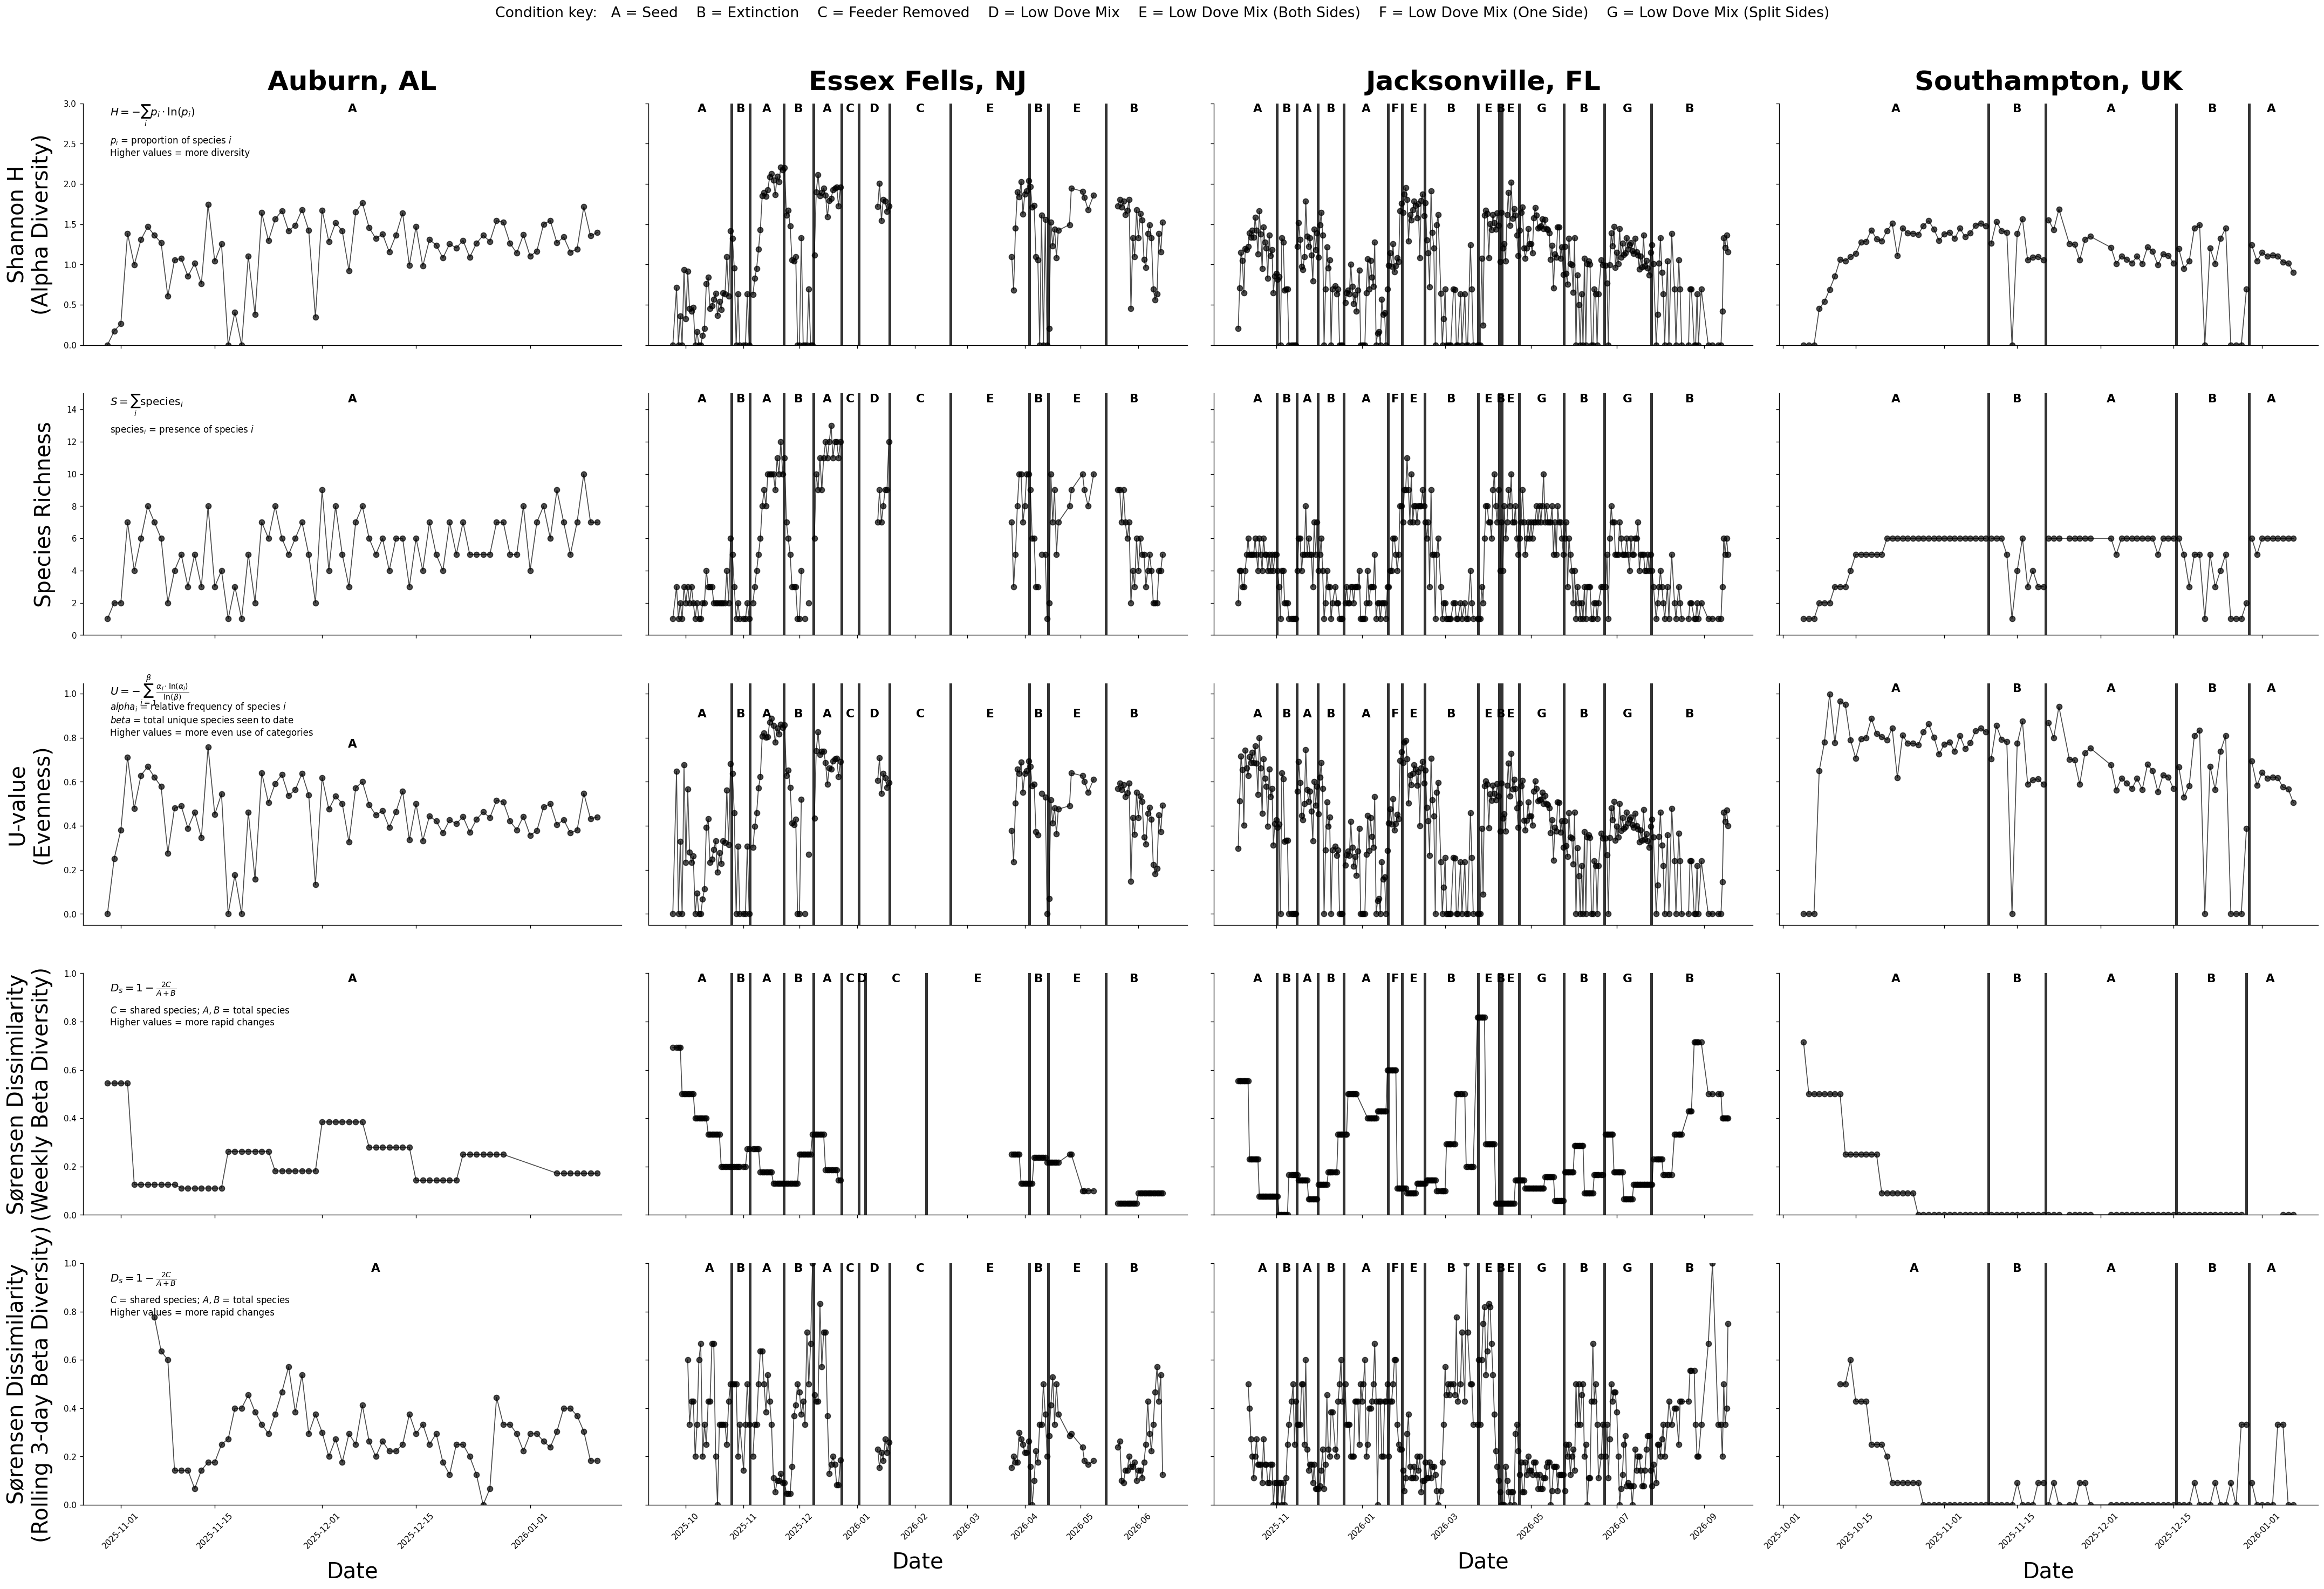
Ecological Diversity Metrics
Type: Static Plot
Created: 2026-10-23T15:56:44.242004
Correlation Matrix of Diversity Metrics
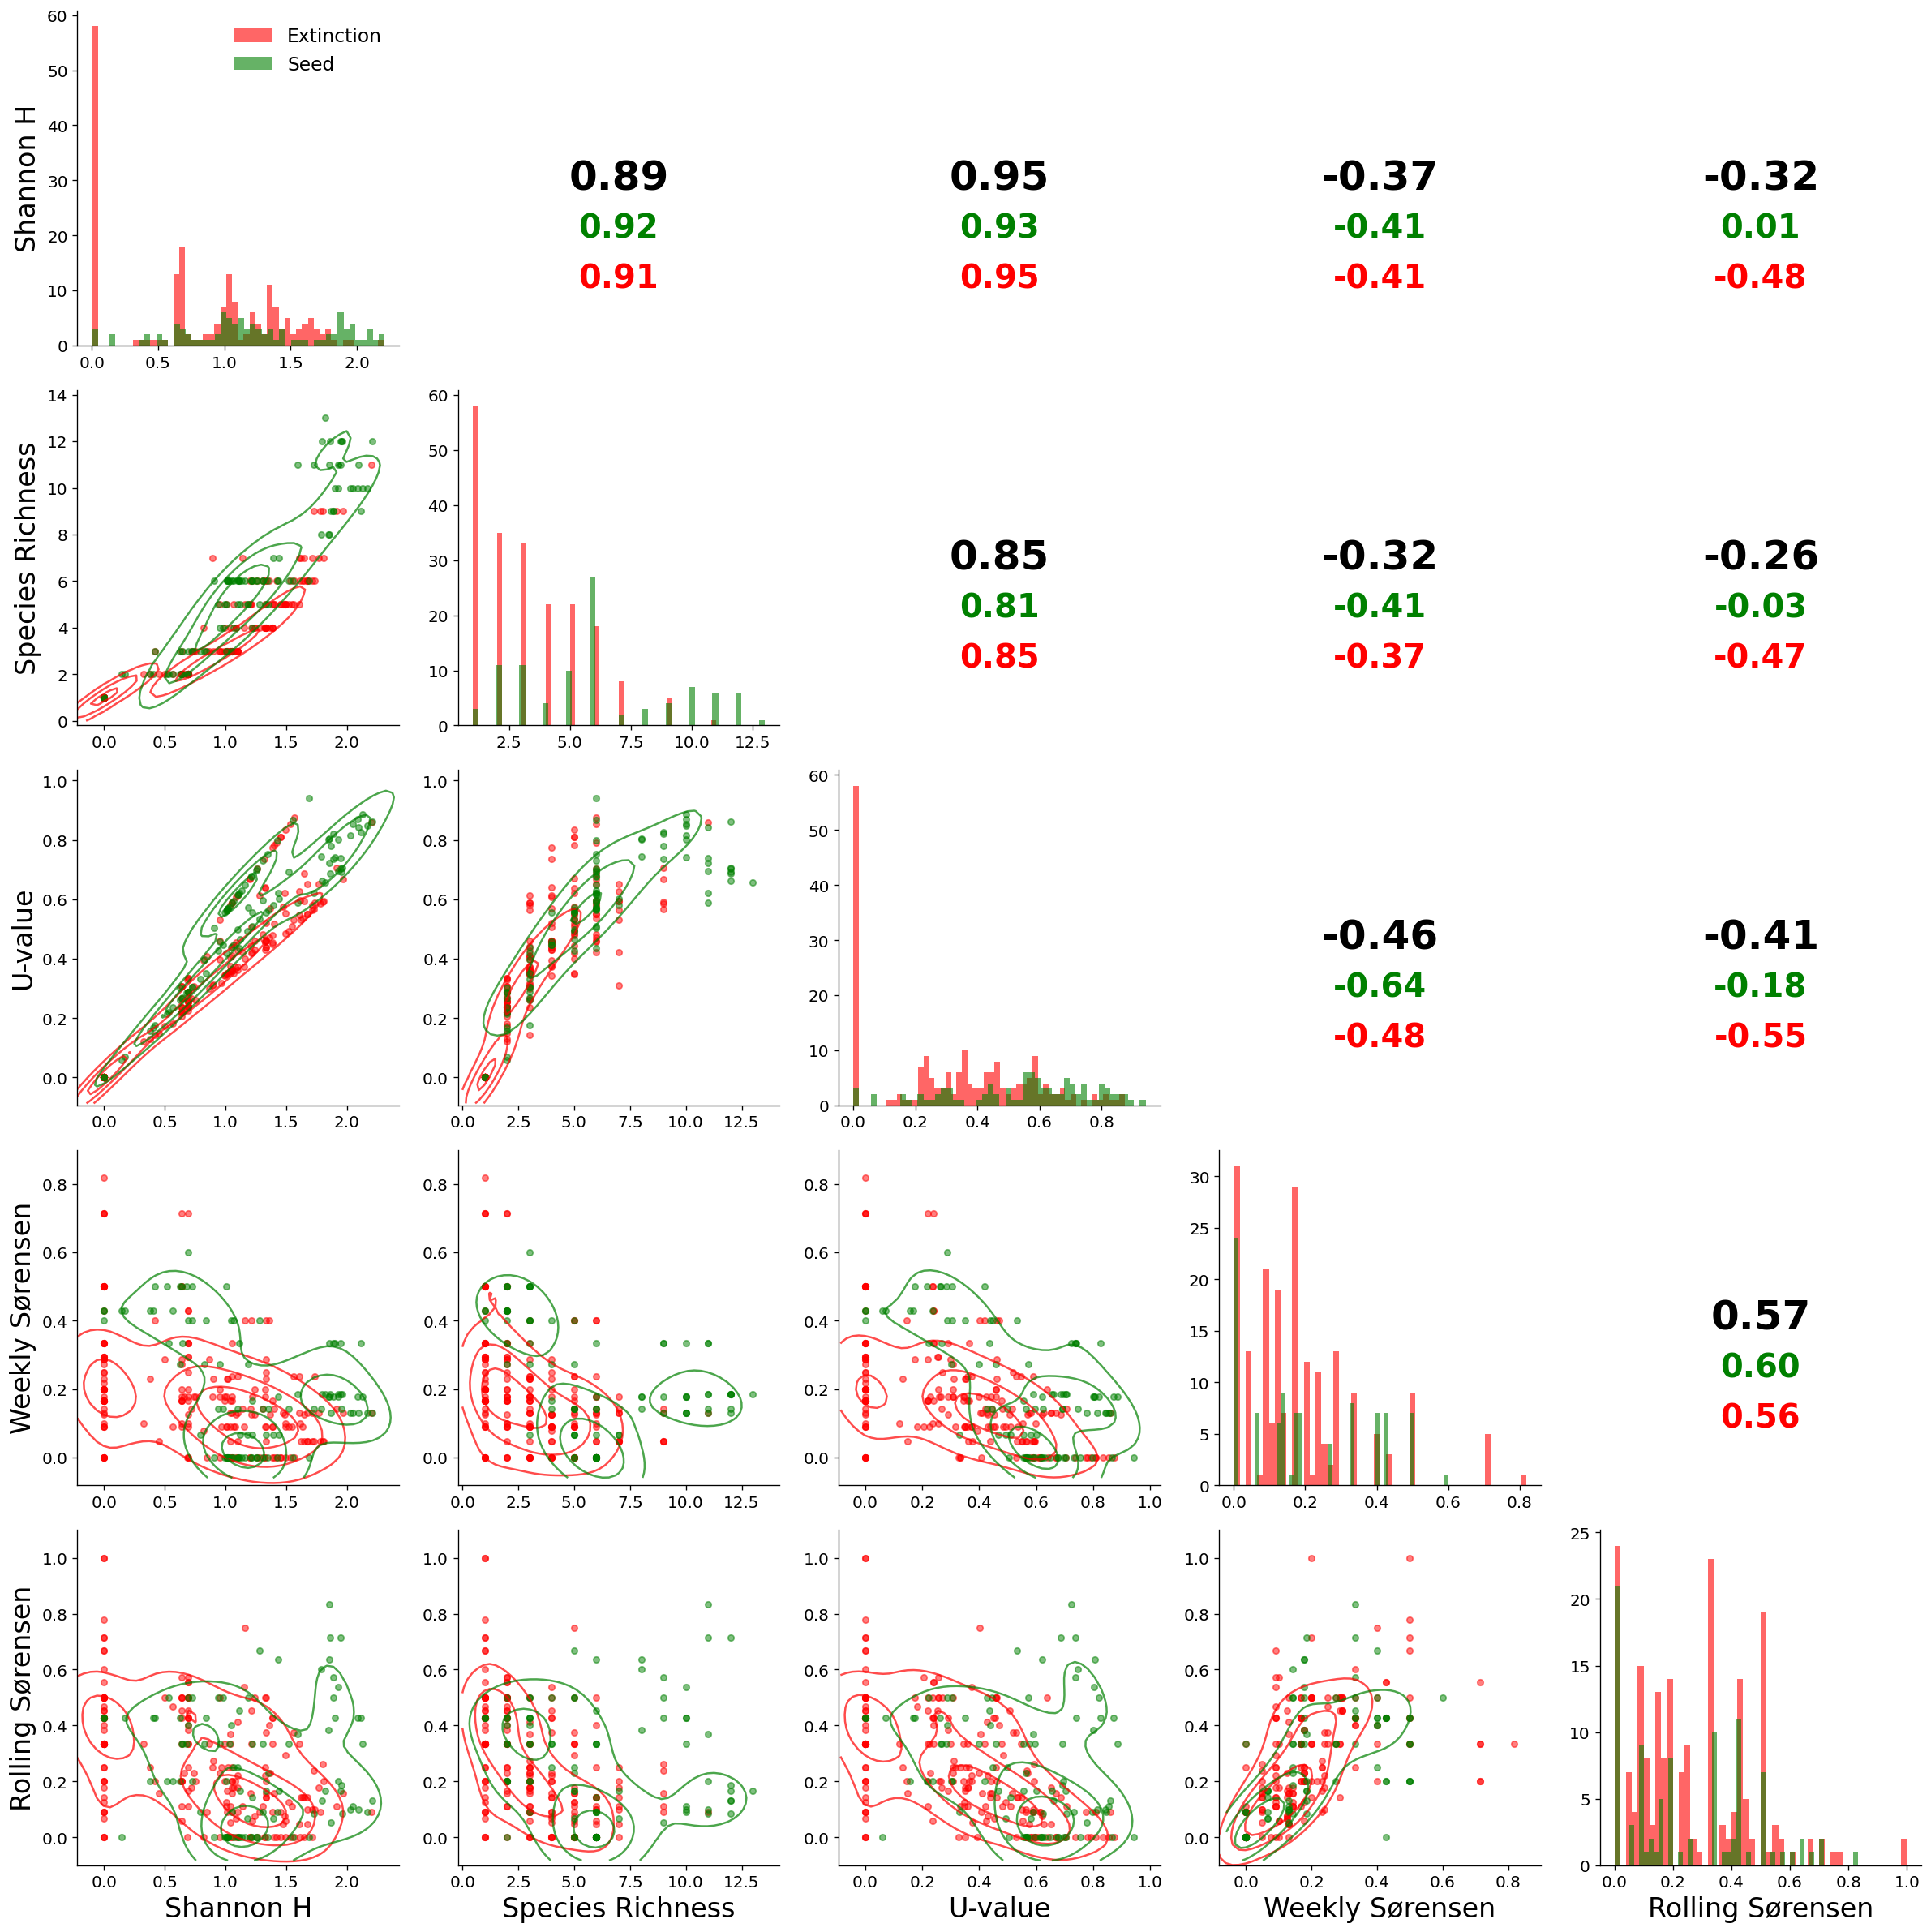
Type: Static Plot
Created: 2026-10-23T15:56:45.952816
Auditory Data from Essex Fells PUC
Type: Static Plot
Created: 2026-10-23T15:56:55.832332
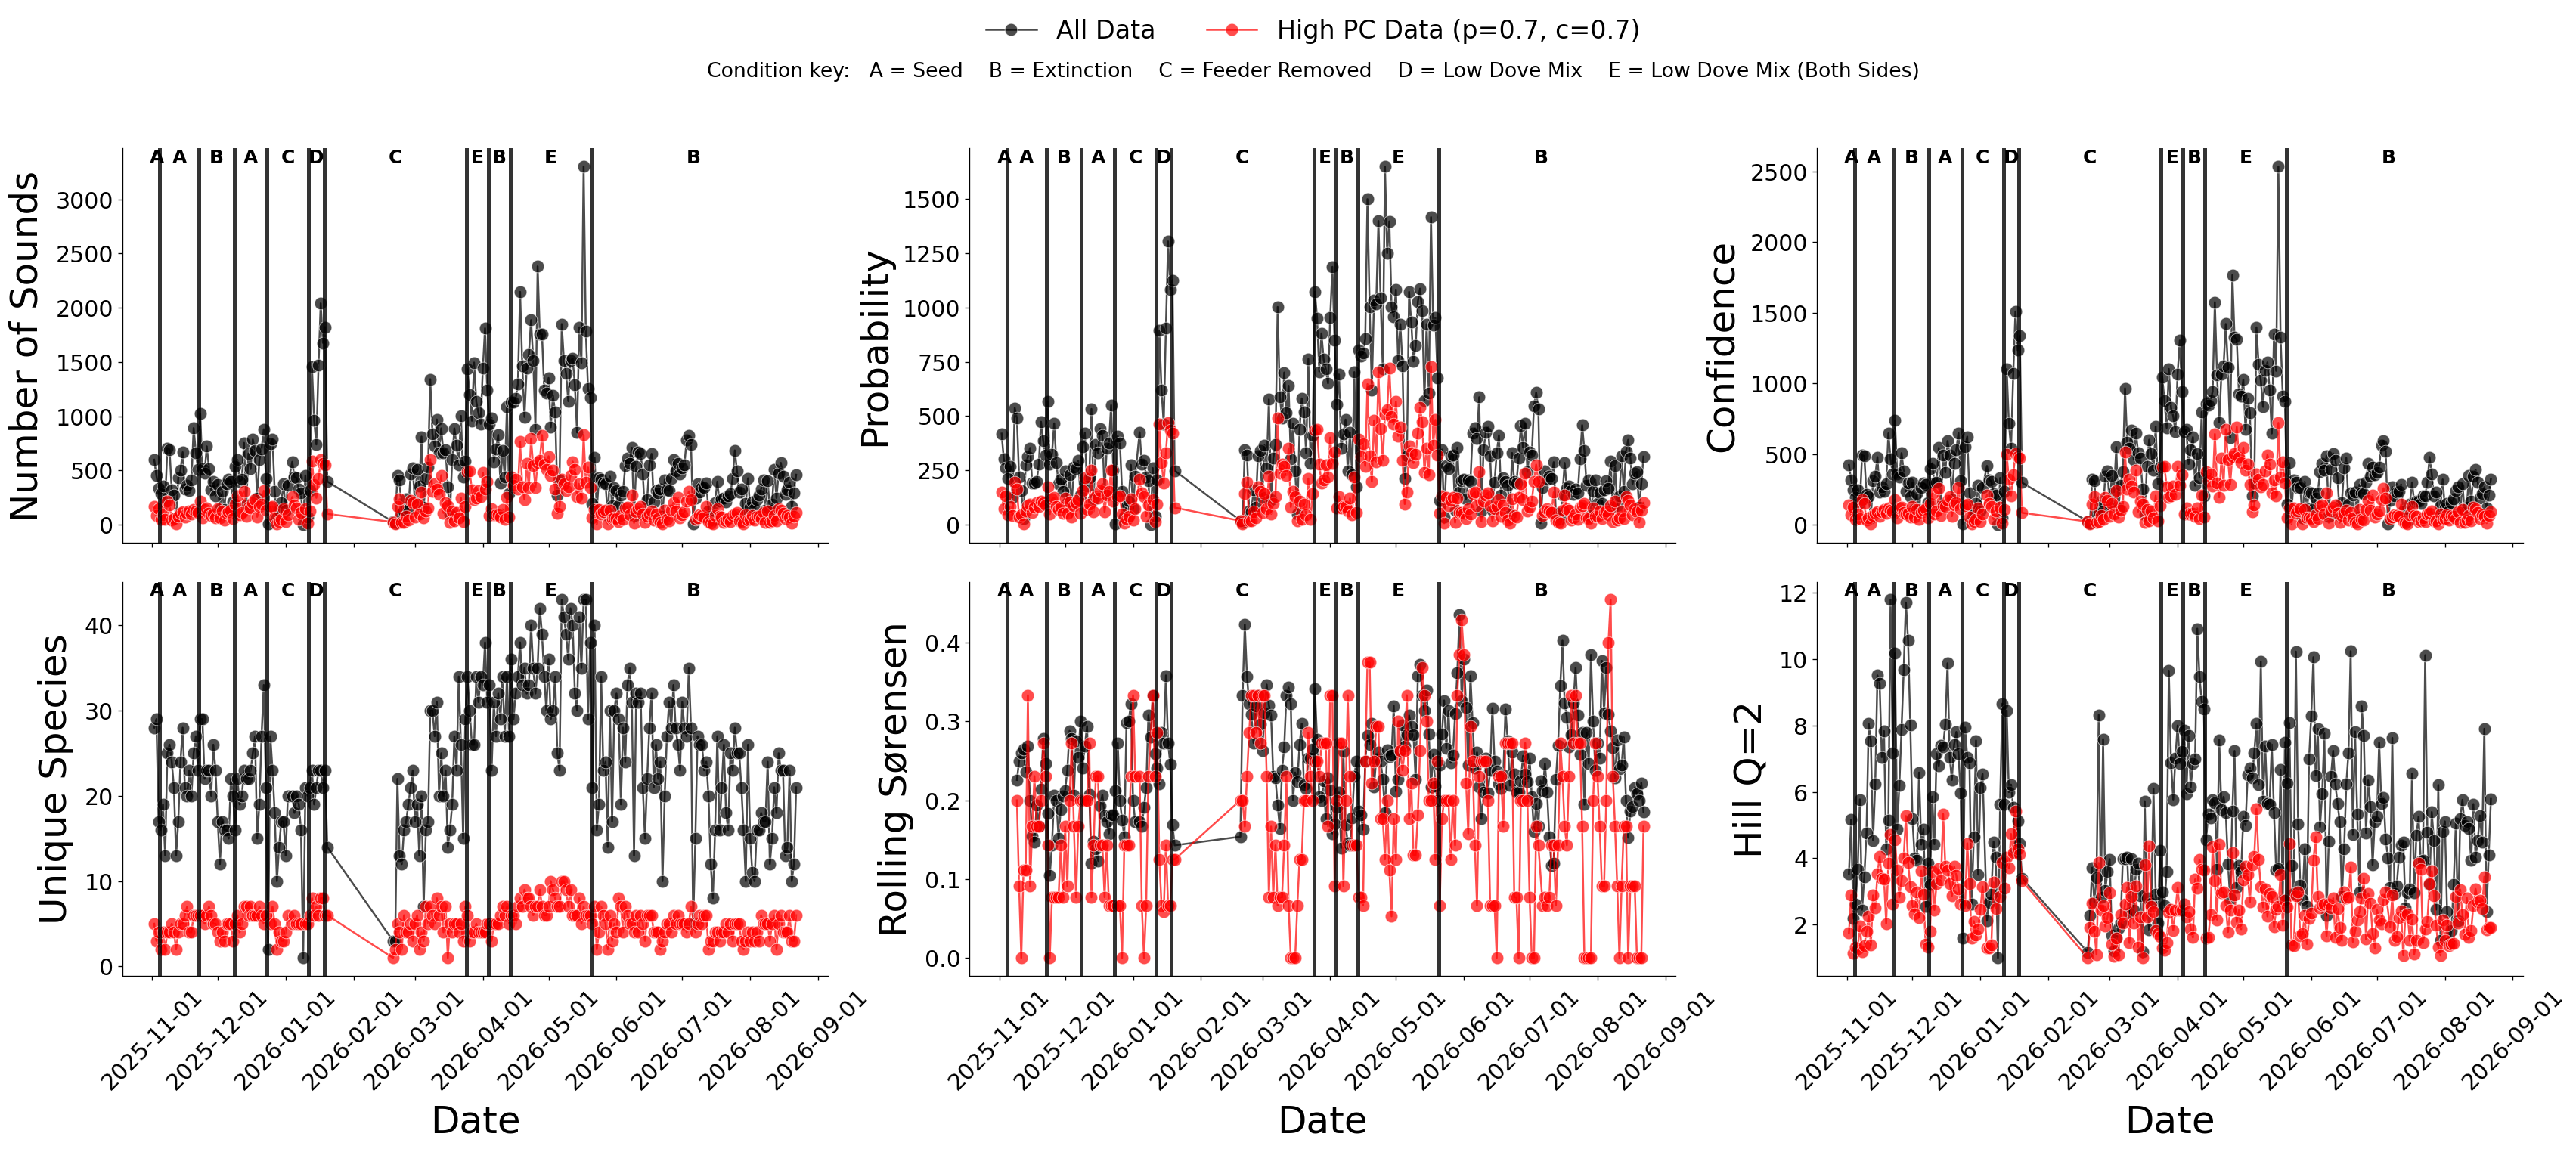
Auditory Data from Jacksonville PUC
Type: Static Plot
Created: 2026-10-23T15:56:56.931773
Auditory Data from Study Site vs County with Migration
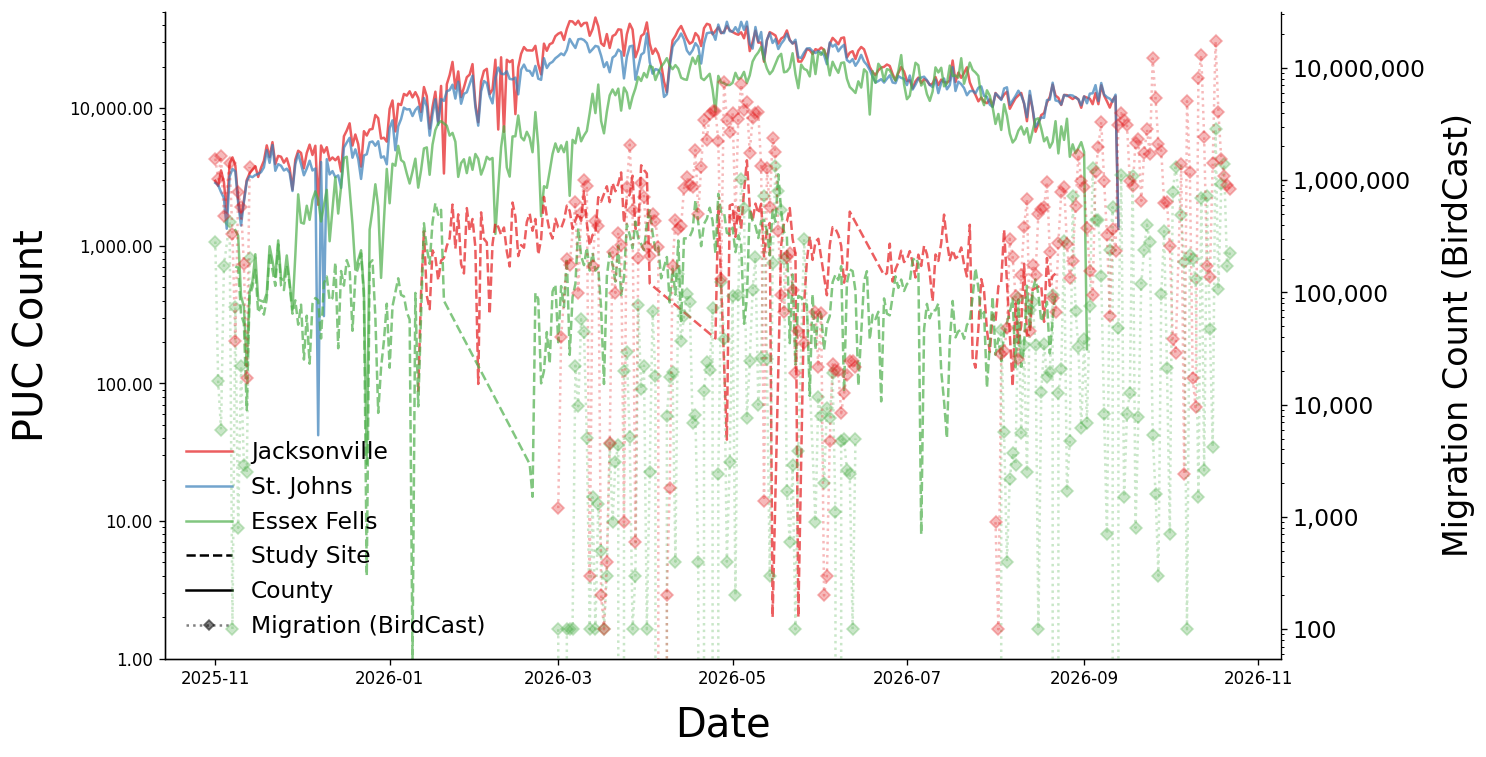
Type: Static Plot
Created: 2026-10-23T15:58:23.346251
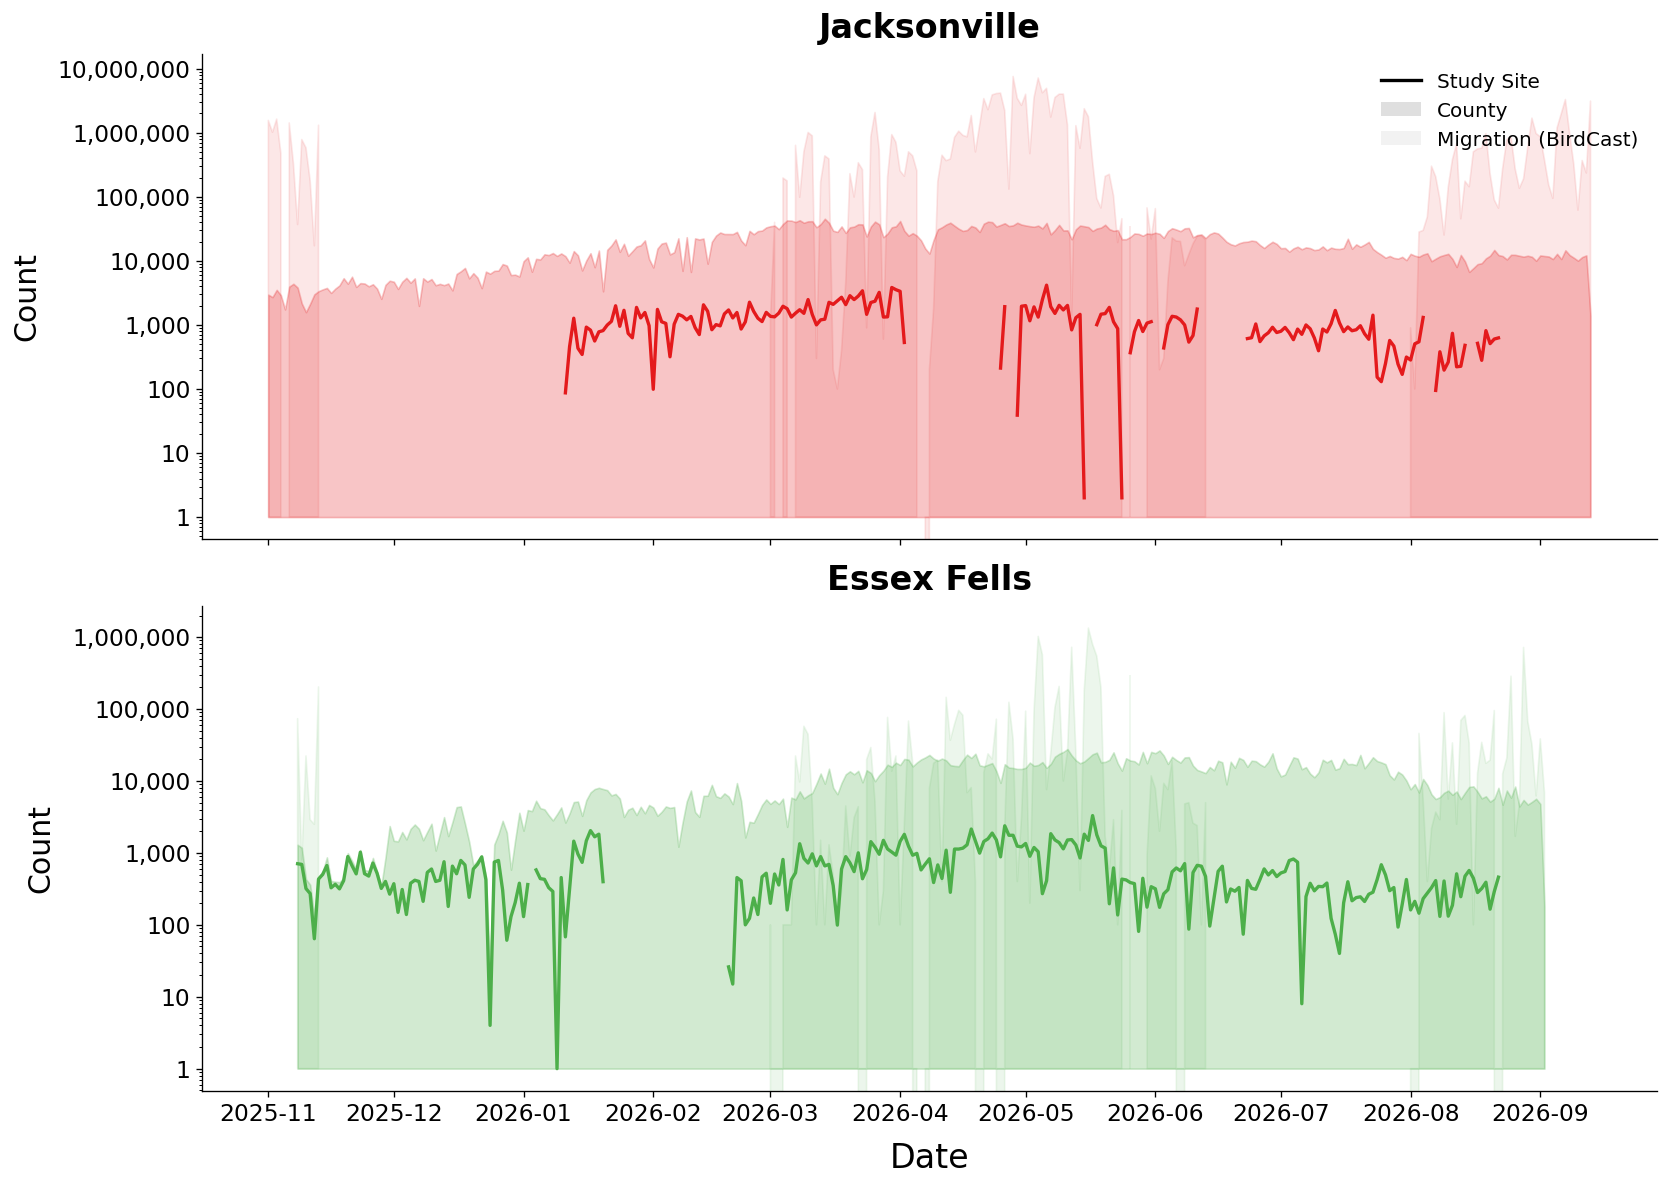
Study Site vs County PUC Activity by Station
Type: Static Plot
Created: 2026-10-23T15:58:23.885433
US Flyway Migration - Total Birds
Type: Interactive Plot
Created: 2026-10-23T16:00:39.970321
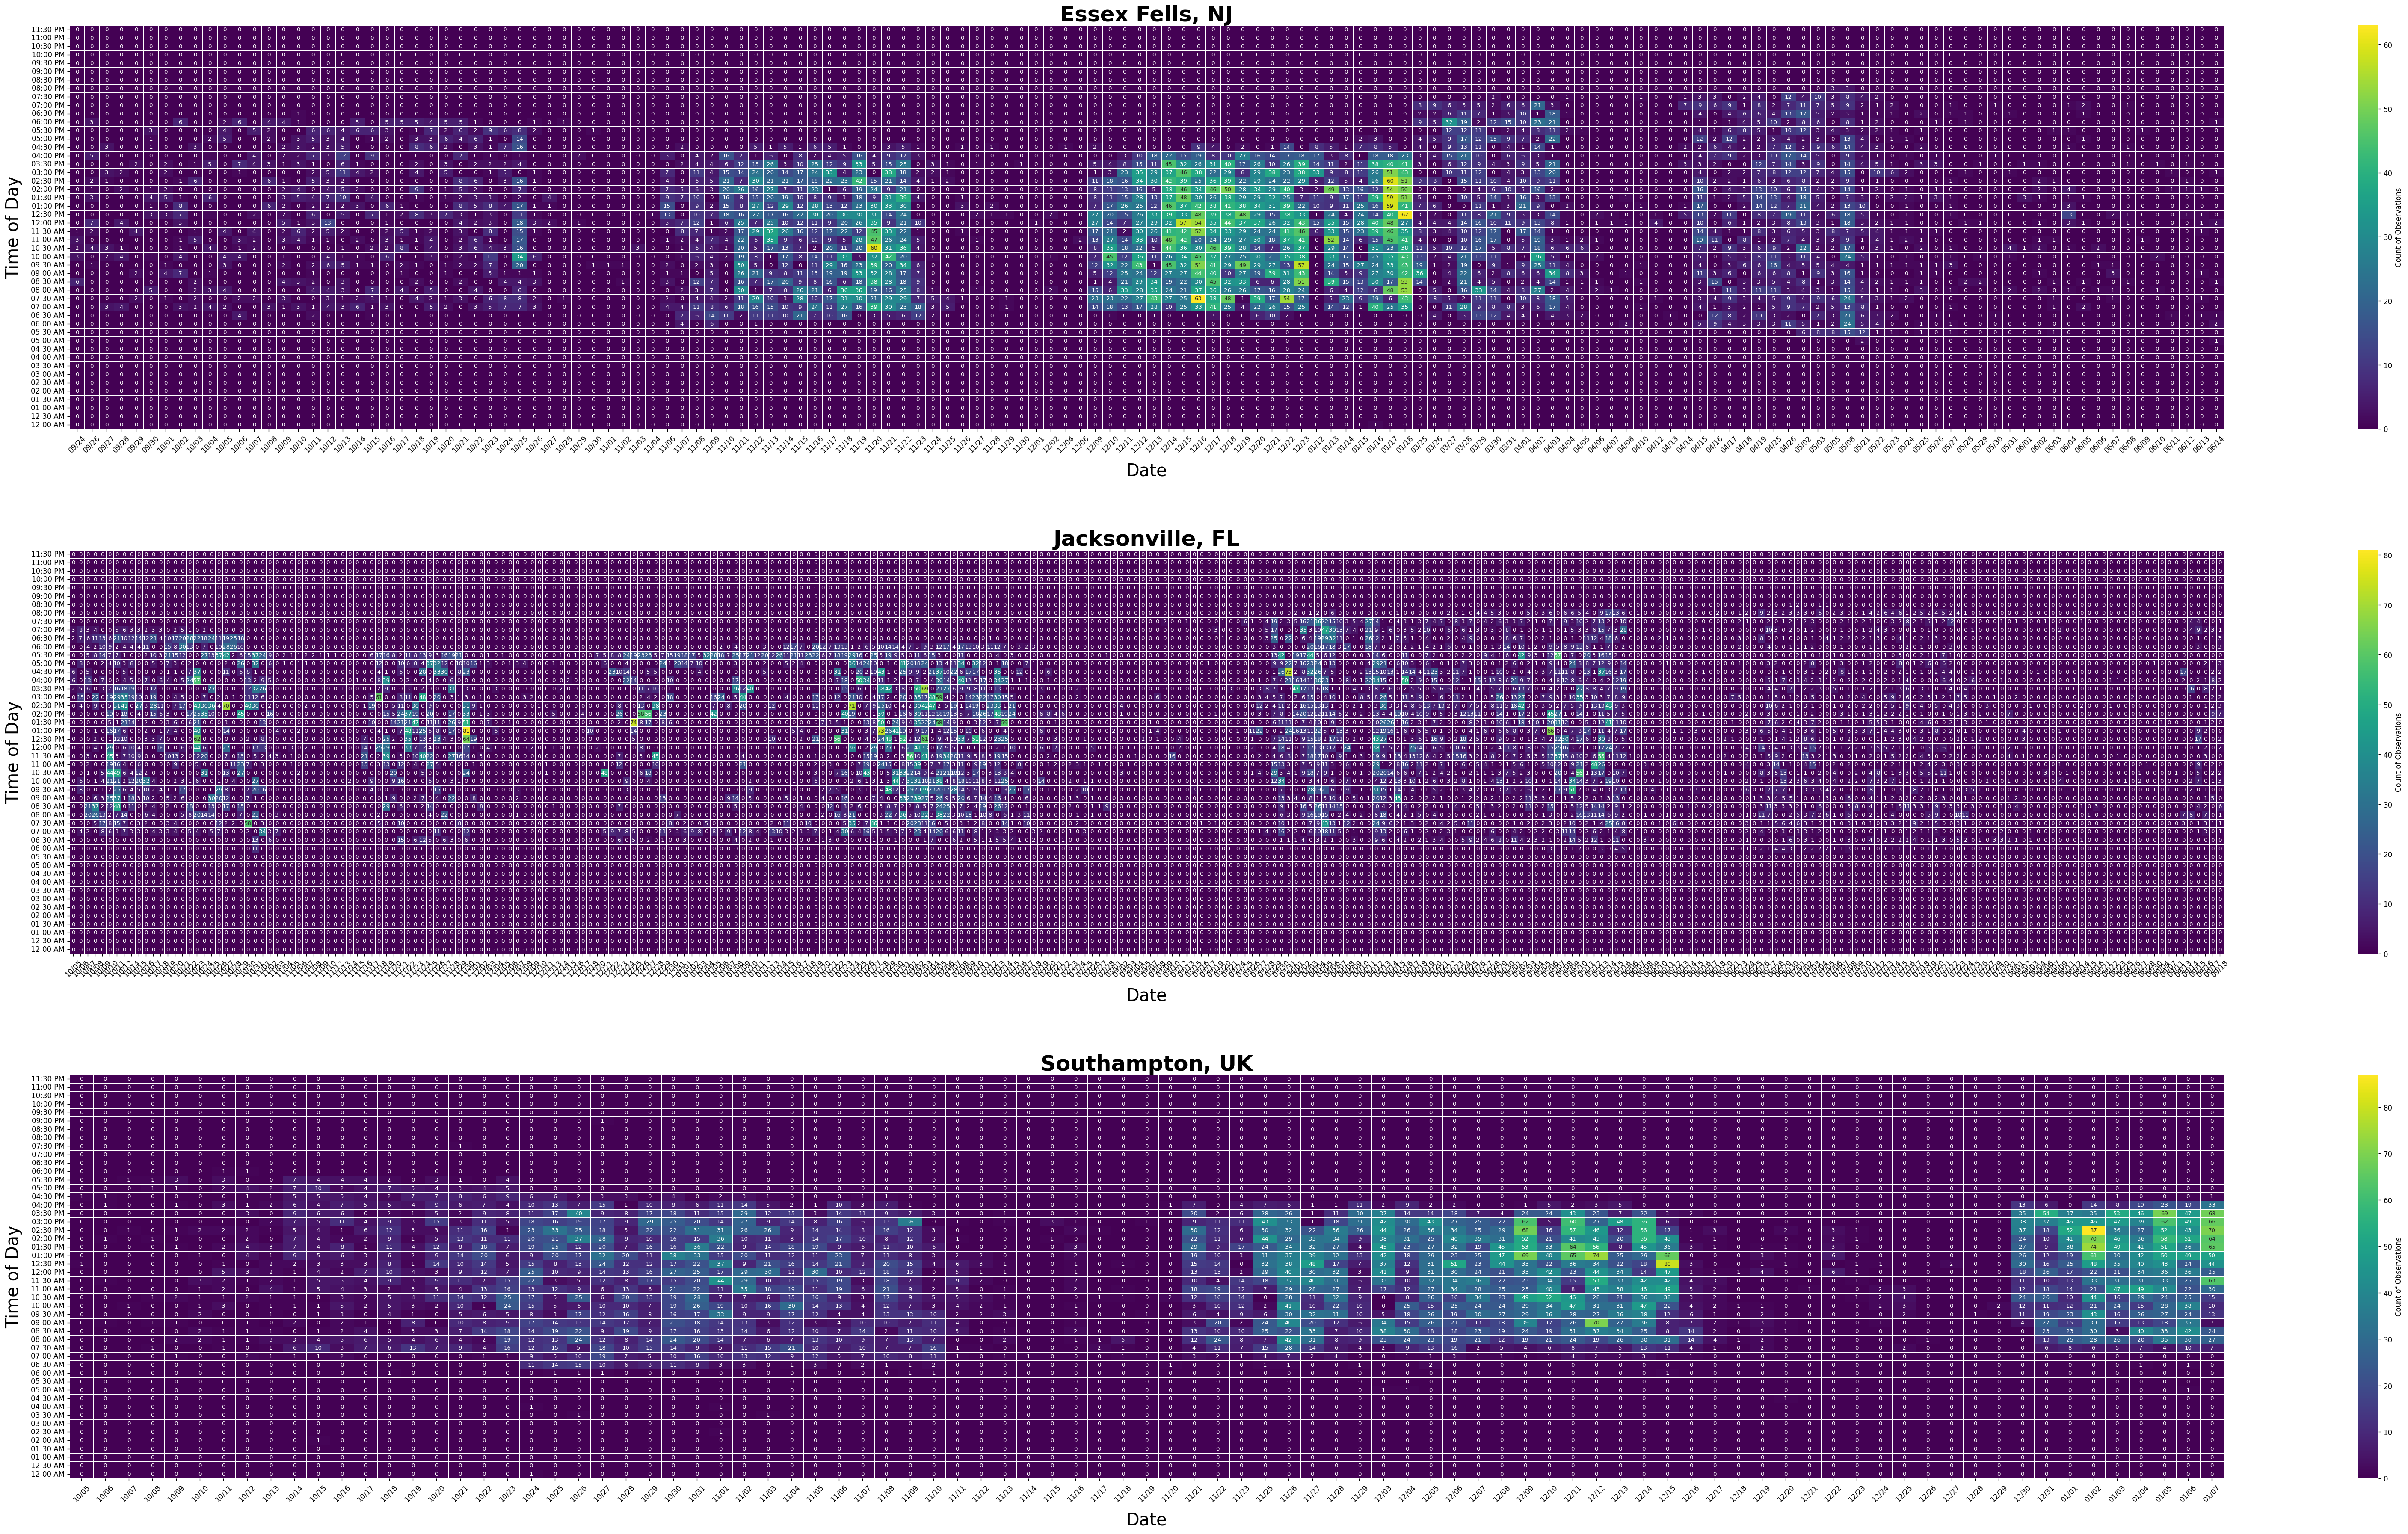
Heatmap: Date vs Time of Day as a Count of Observations
Type: Static Plot
Created: 2026-10-23T15:55:41.659191
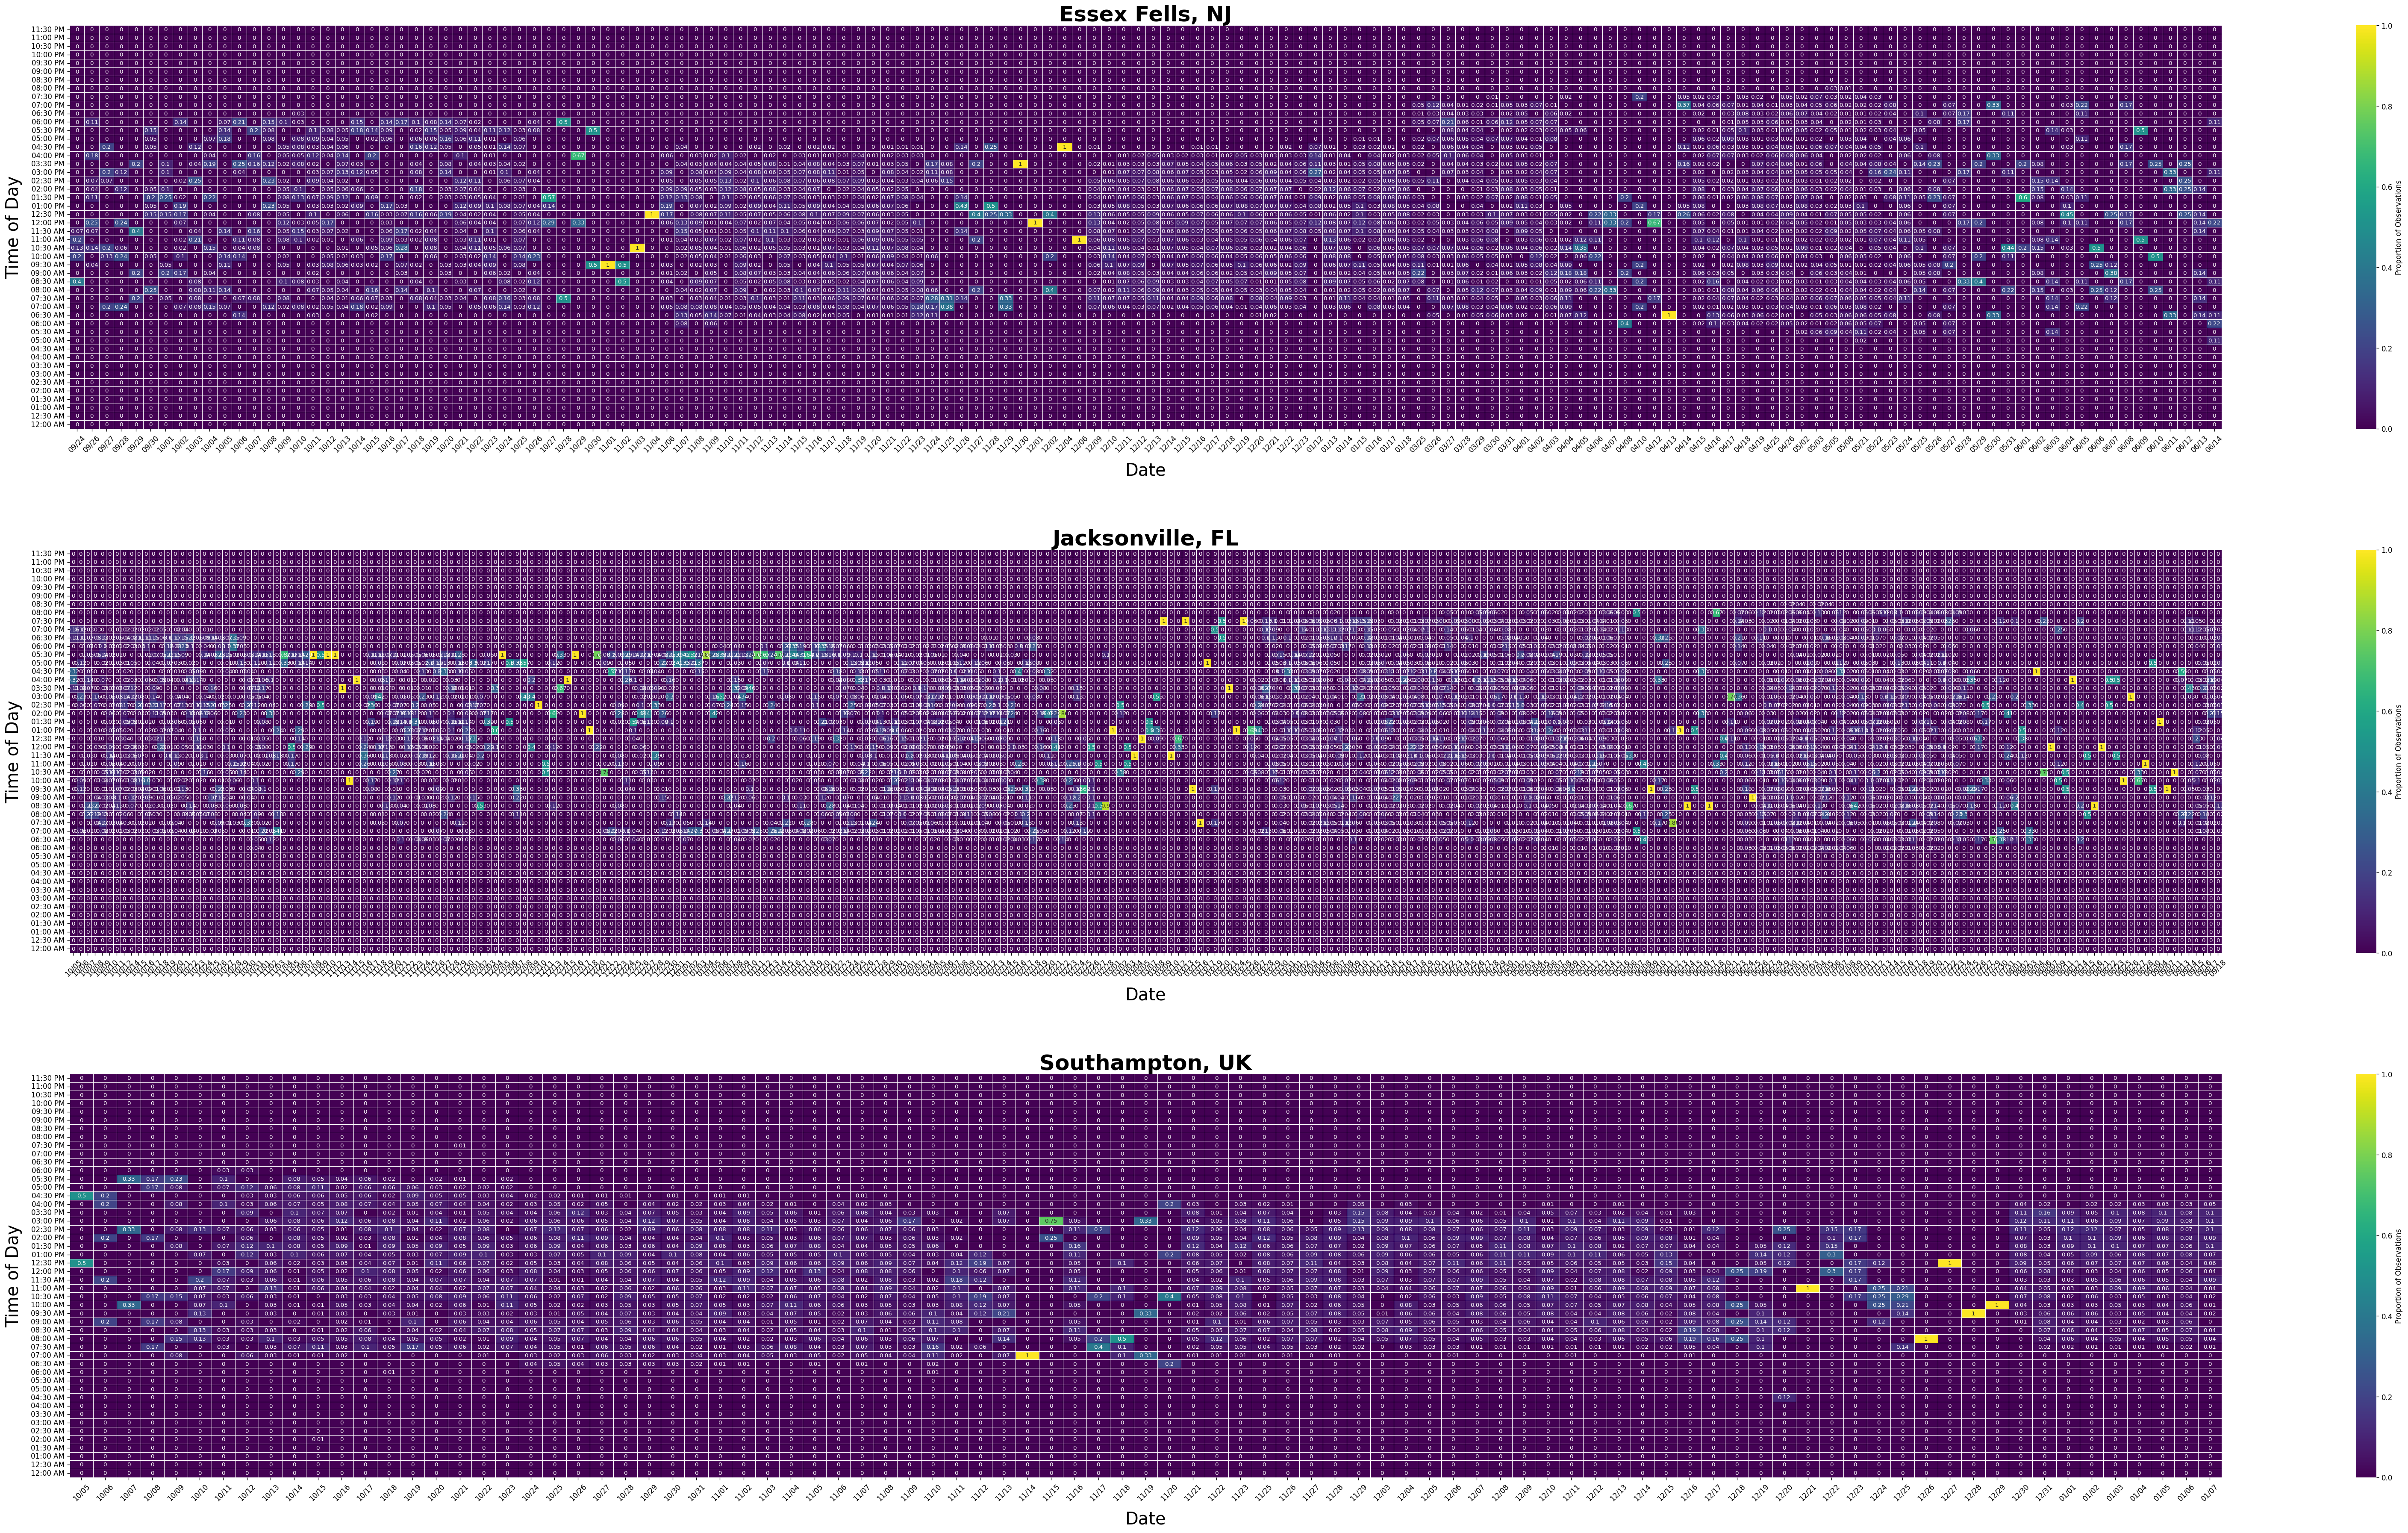
Heatmap: Date vs Time of Day as a Proportion of Observations
Type: Static Plot
Created: 2026-10-23T15:56:06.633749
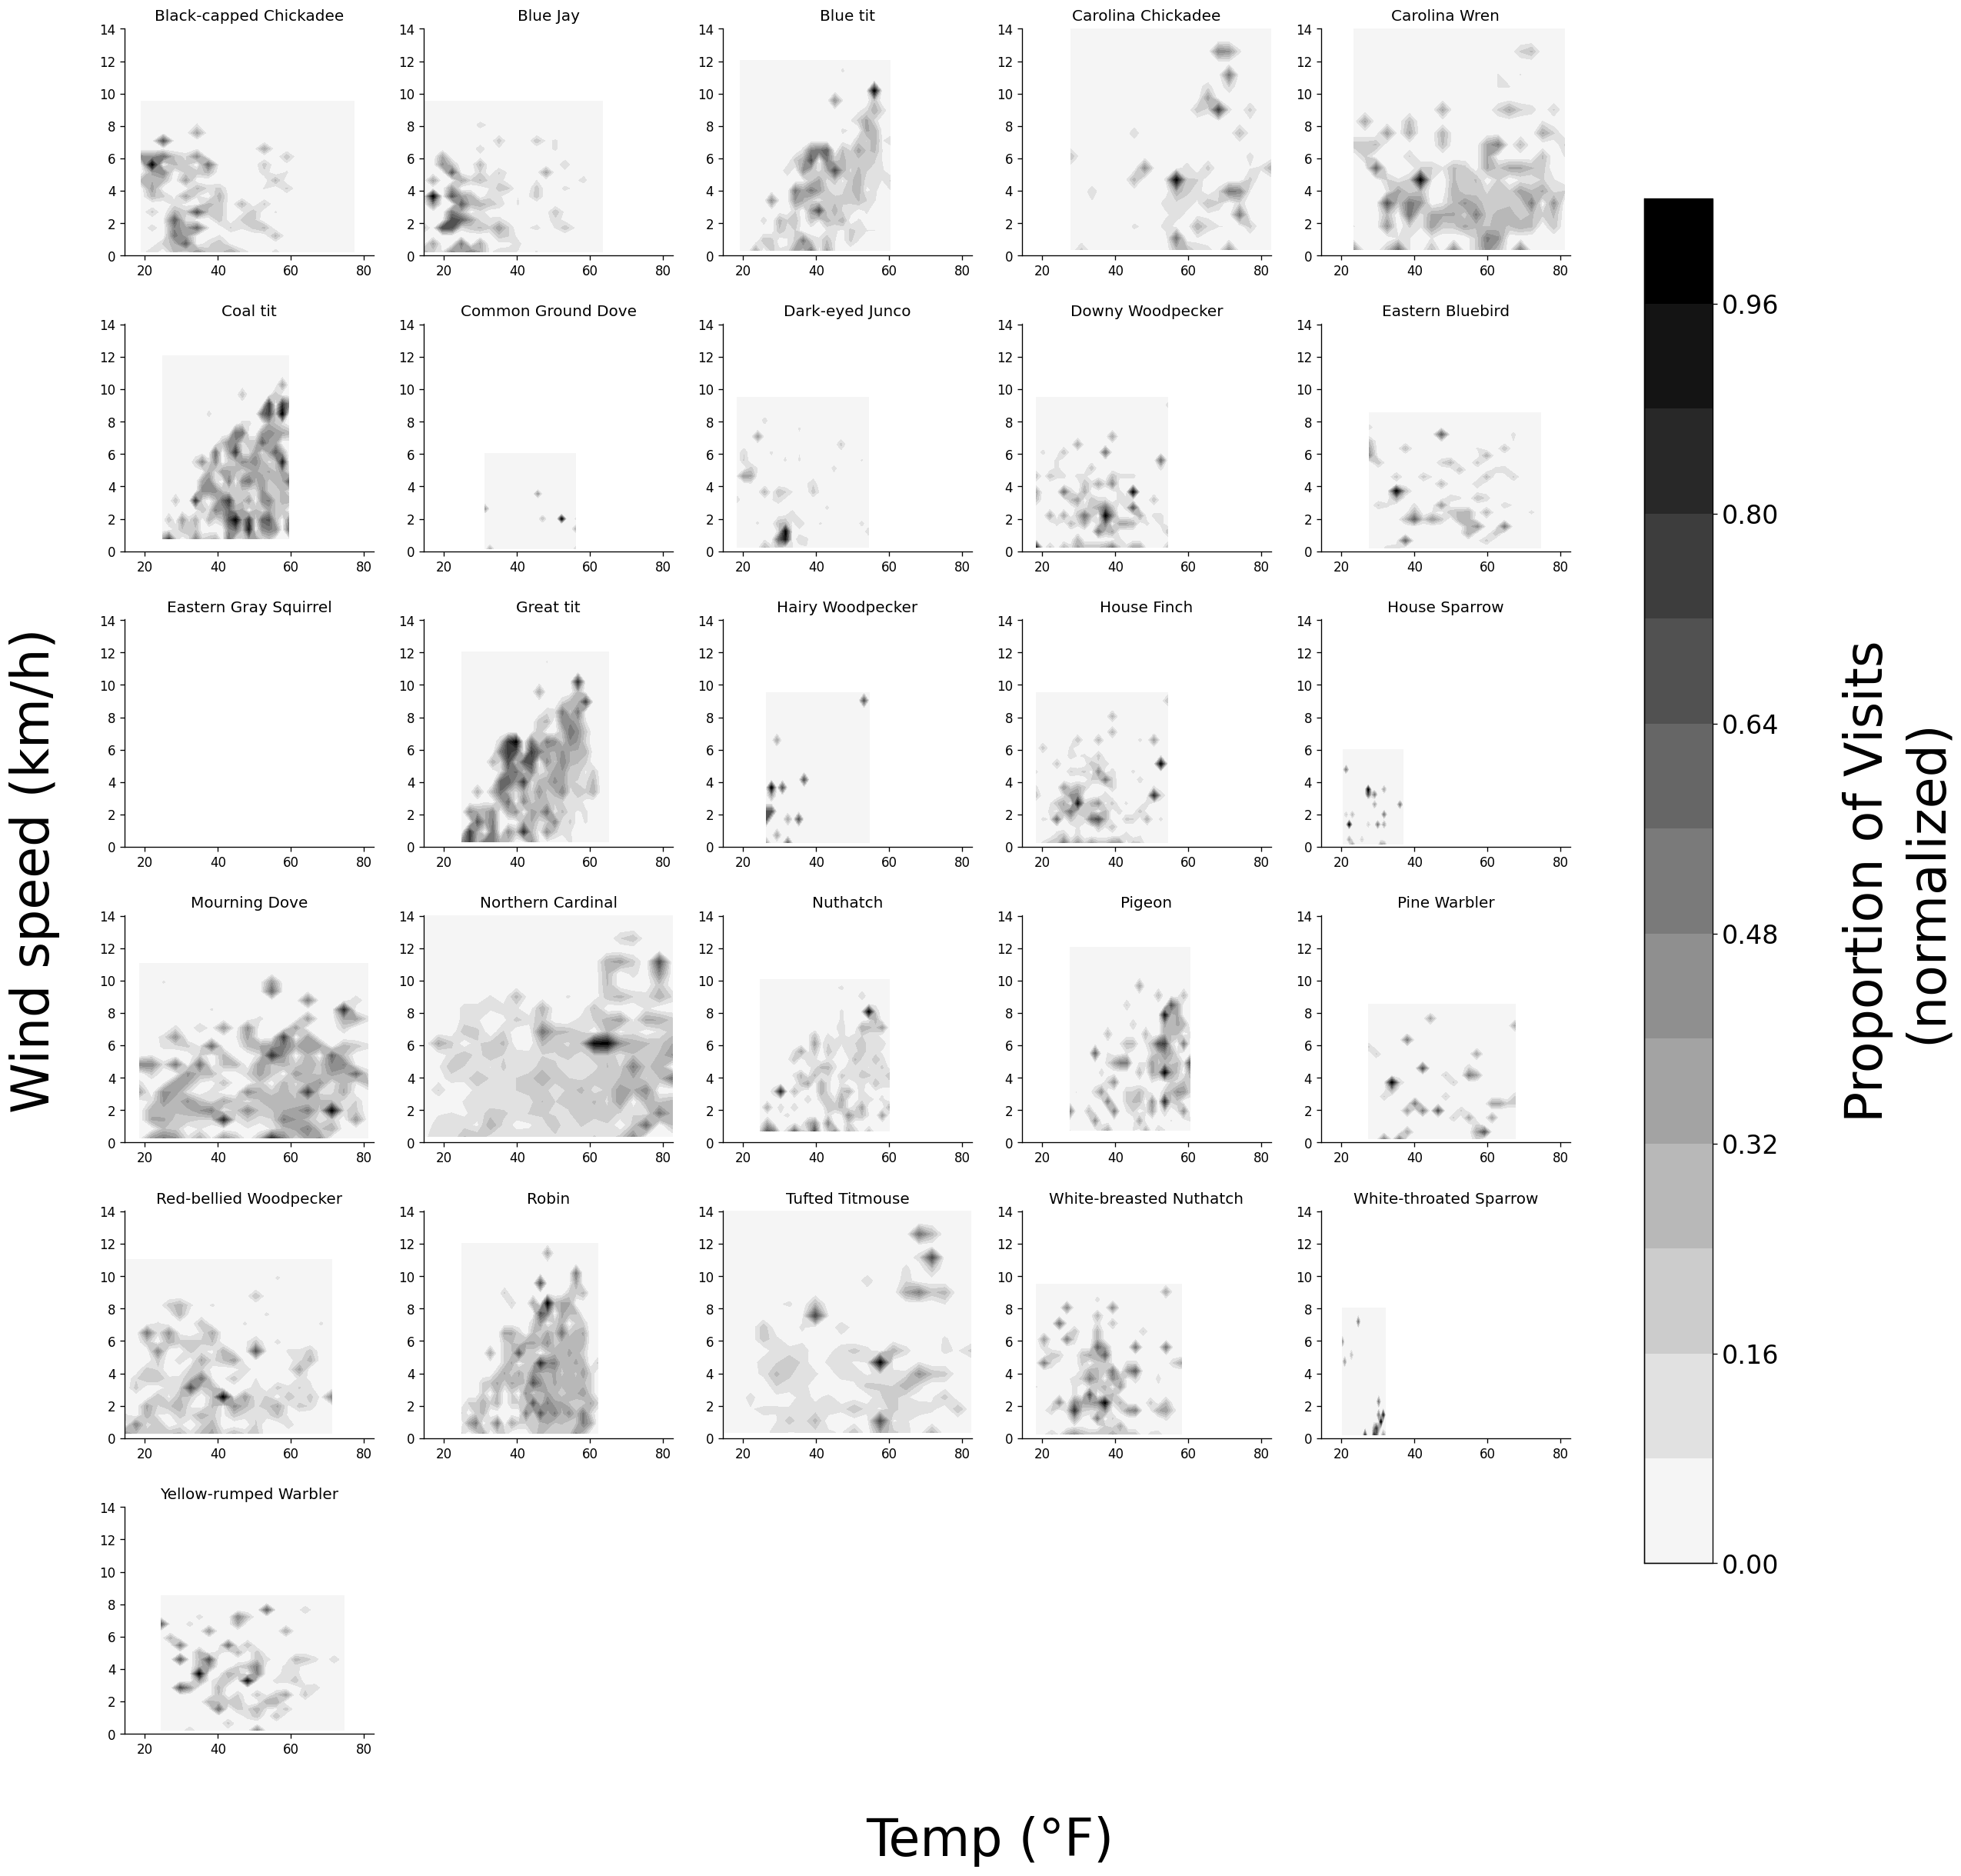
Proportion of visits by wind speed and temperature
Type: Static Plot
Created: 2026-10-23T15:56:09.927446
Species Clustermap Using Visits and Weather
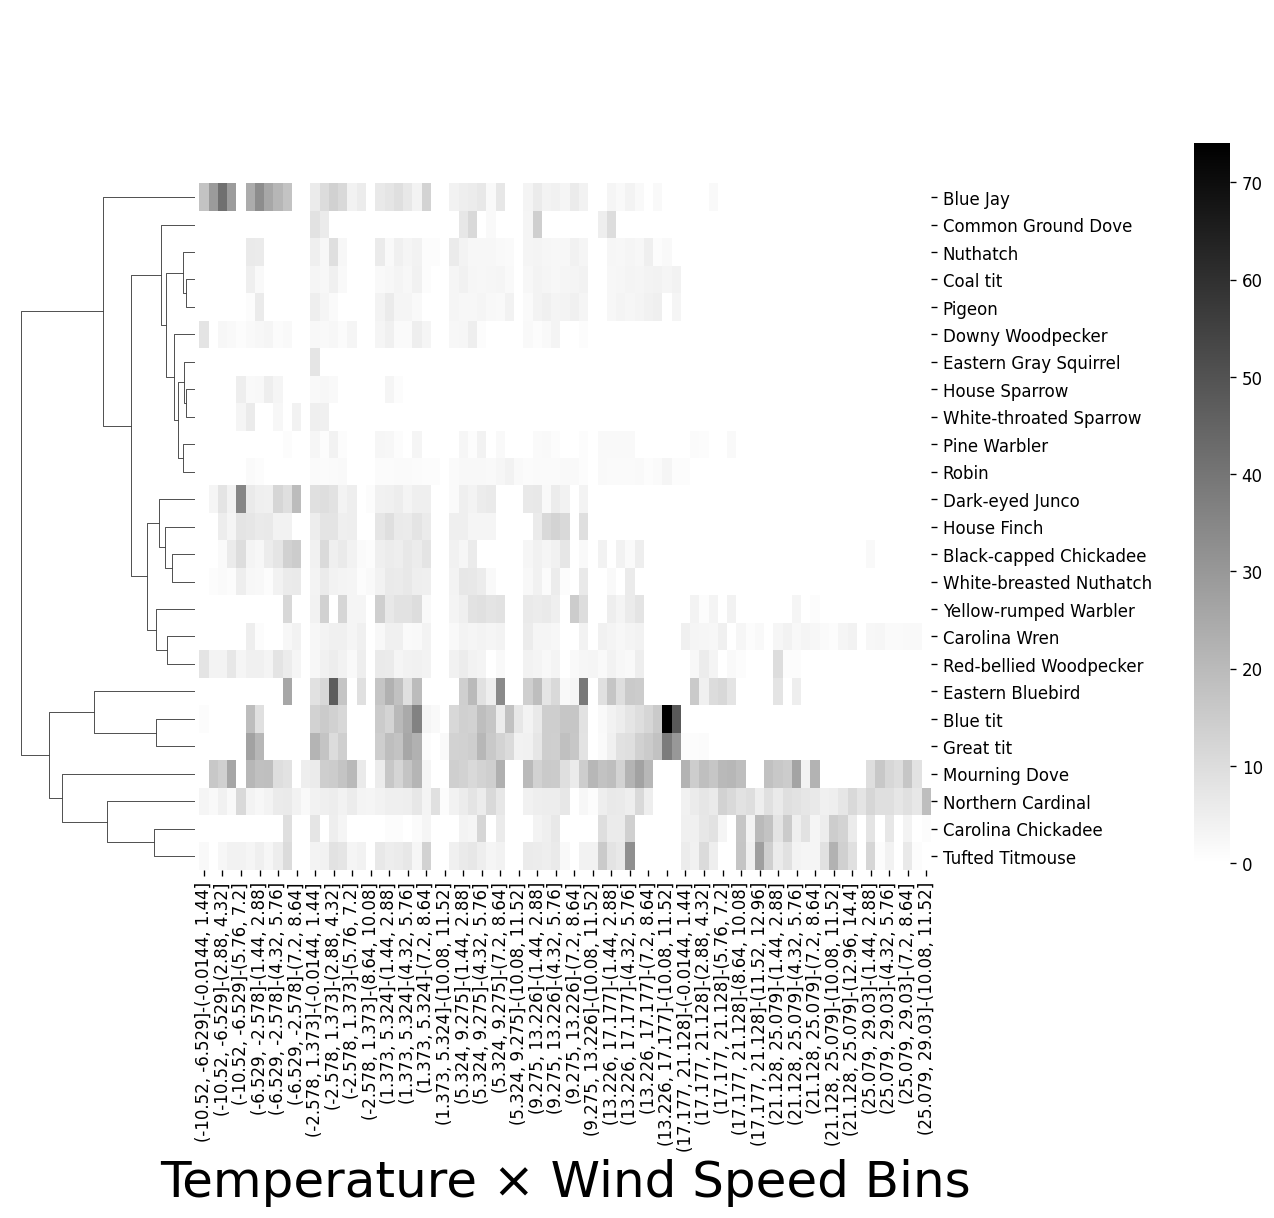
Type: Static Plot
Created: 2026-10-23T15:56:08.097456
All Birds: Bout Analysis
Type: Static Plot
Created: 2026-10-23T15:56:21.203940
All Birds: Bout Analysis Separating Seed and No Seed Conditions
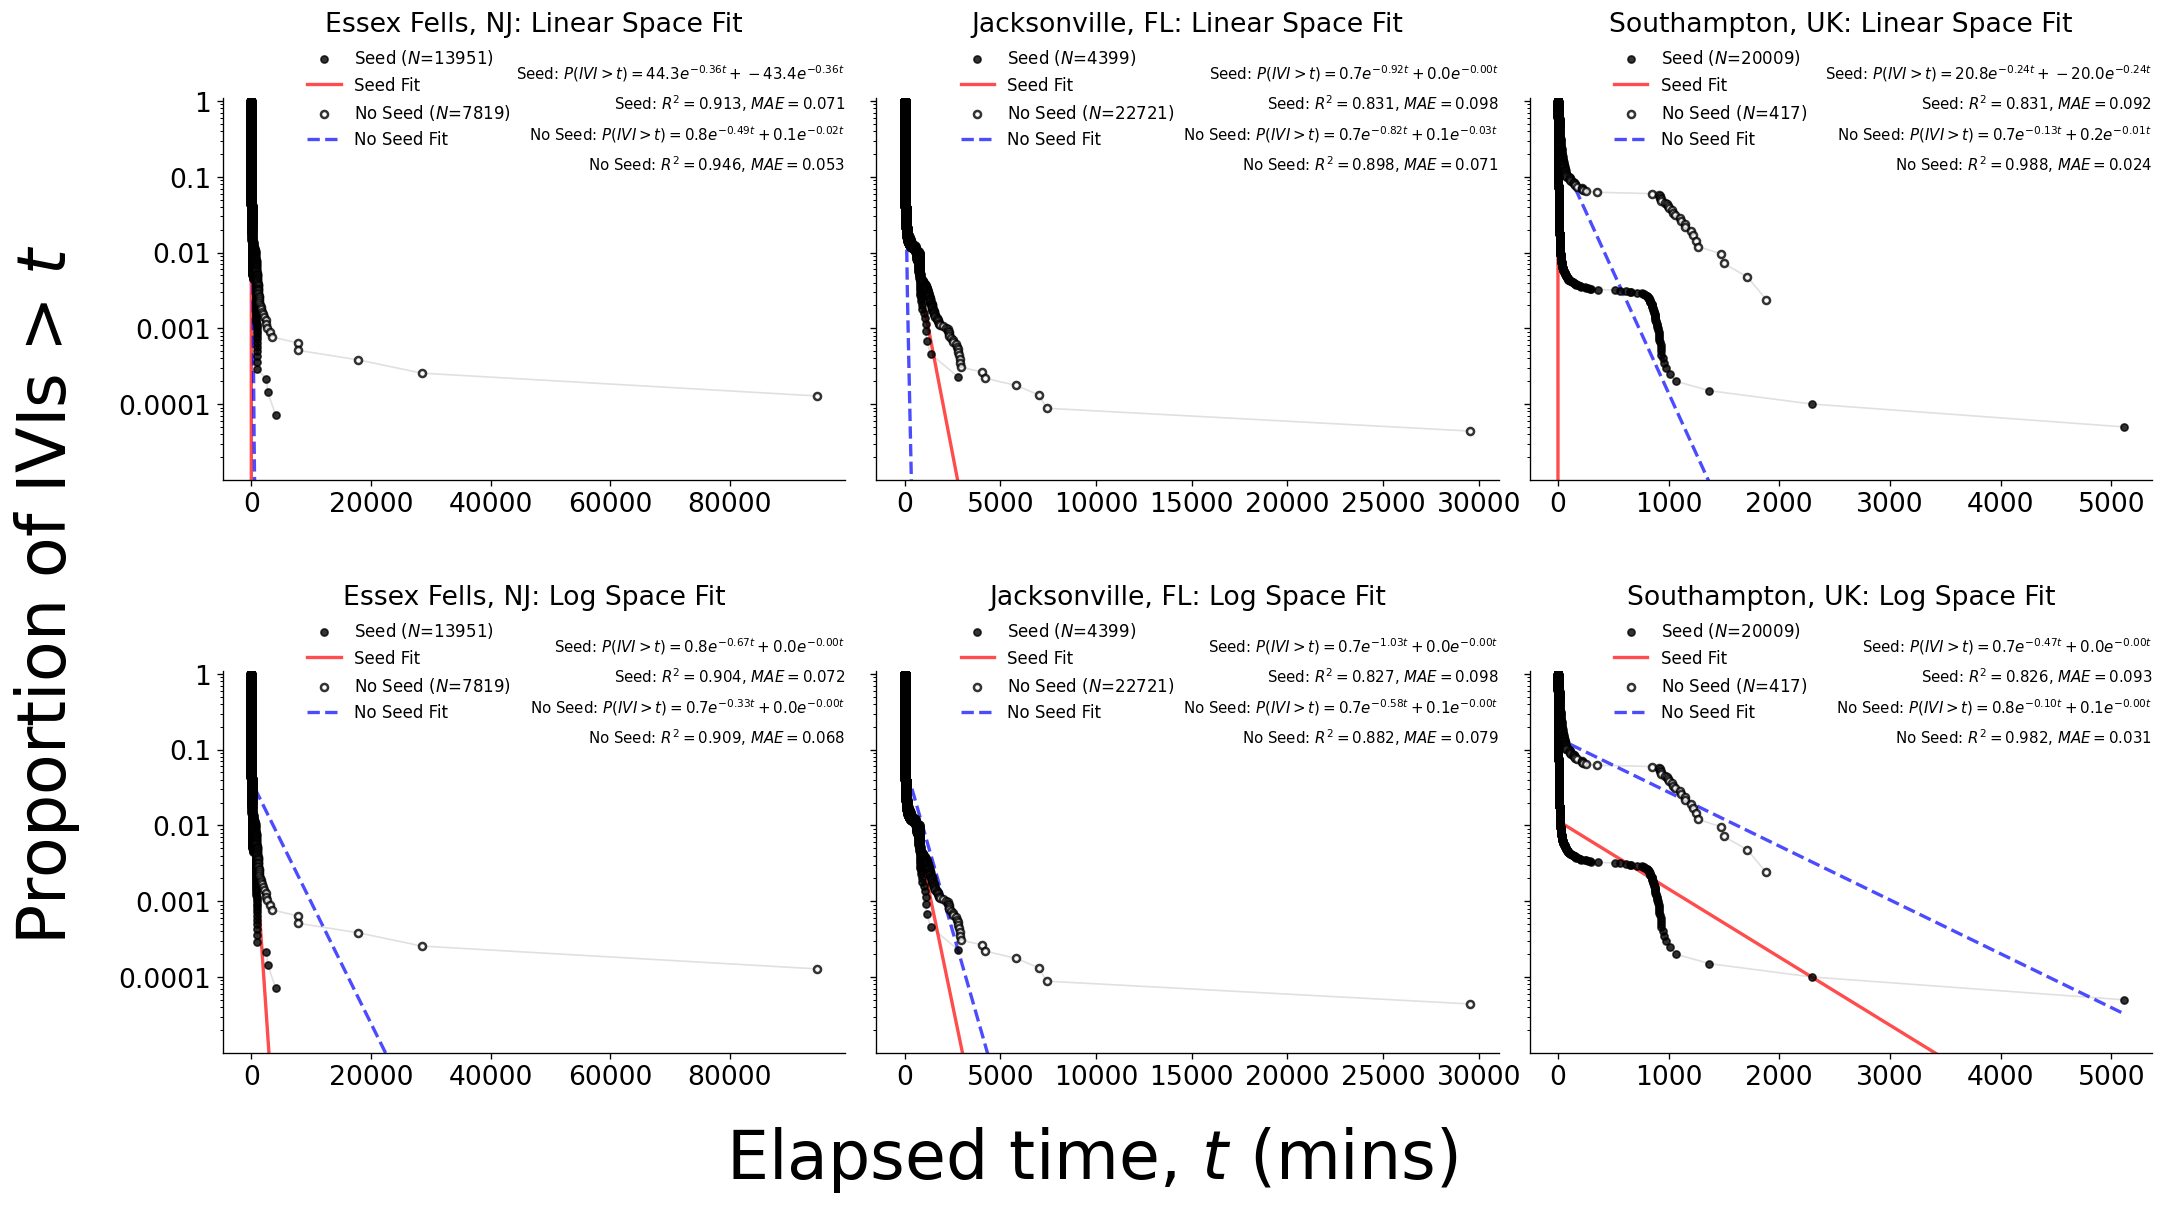
Type: Static Plot
Created: 2026-10-23T15:56:25.242292
All Birds: Bout Analysis (Within-Date Only)
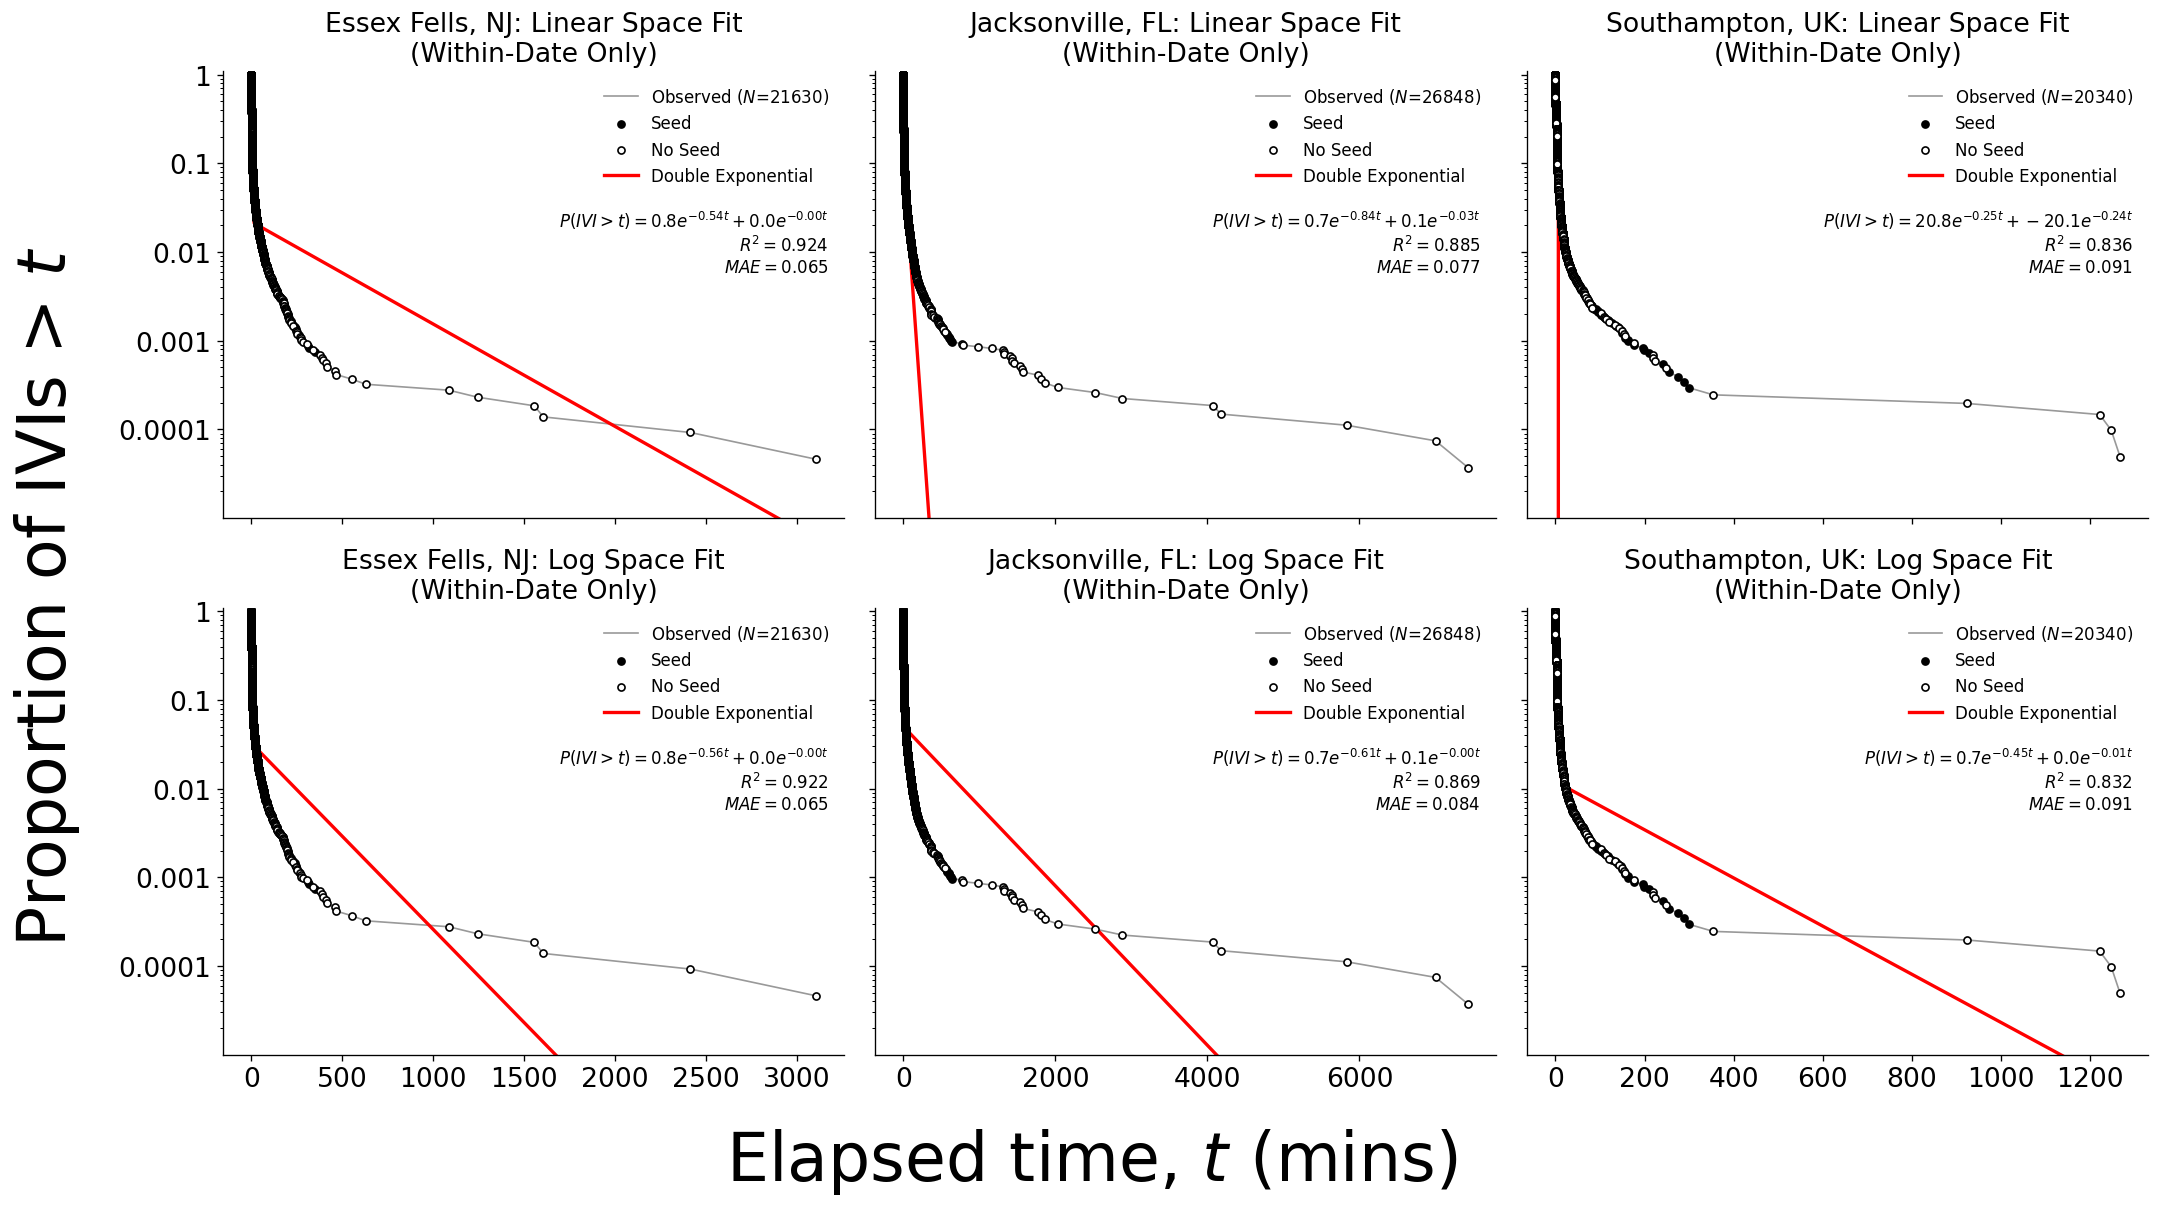
Type: Static Plot
Created: 2026-10-23T15:56:23.171041
Bird Species: Bout Analysis (log space)
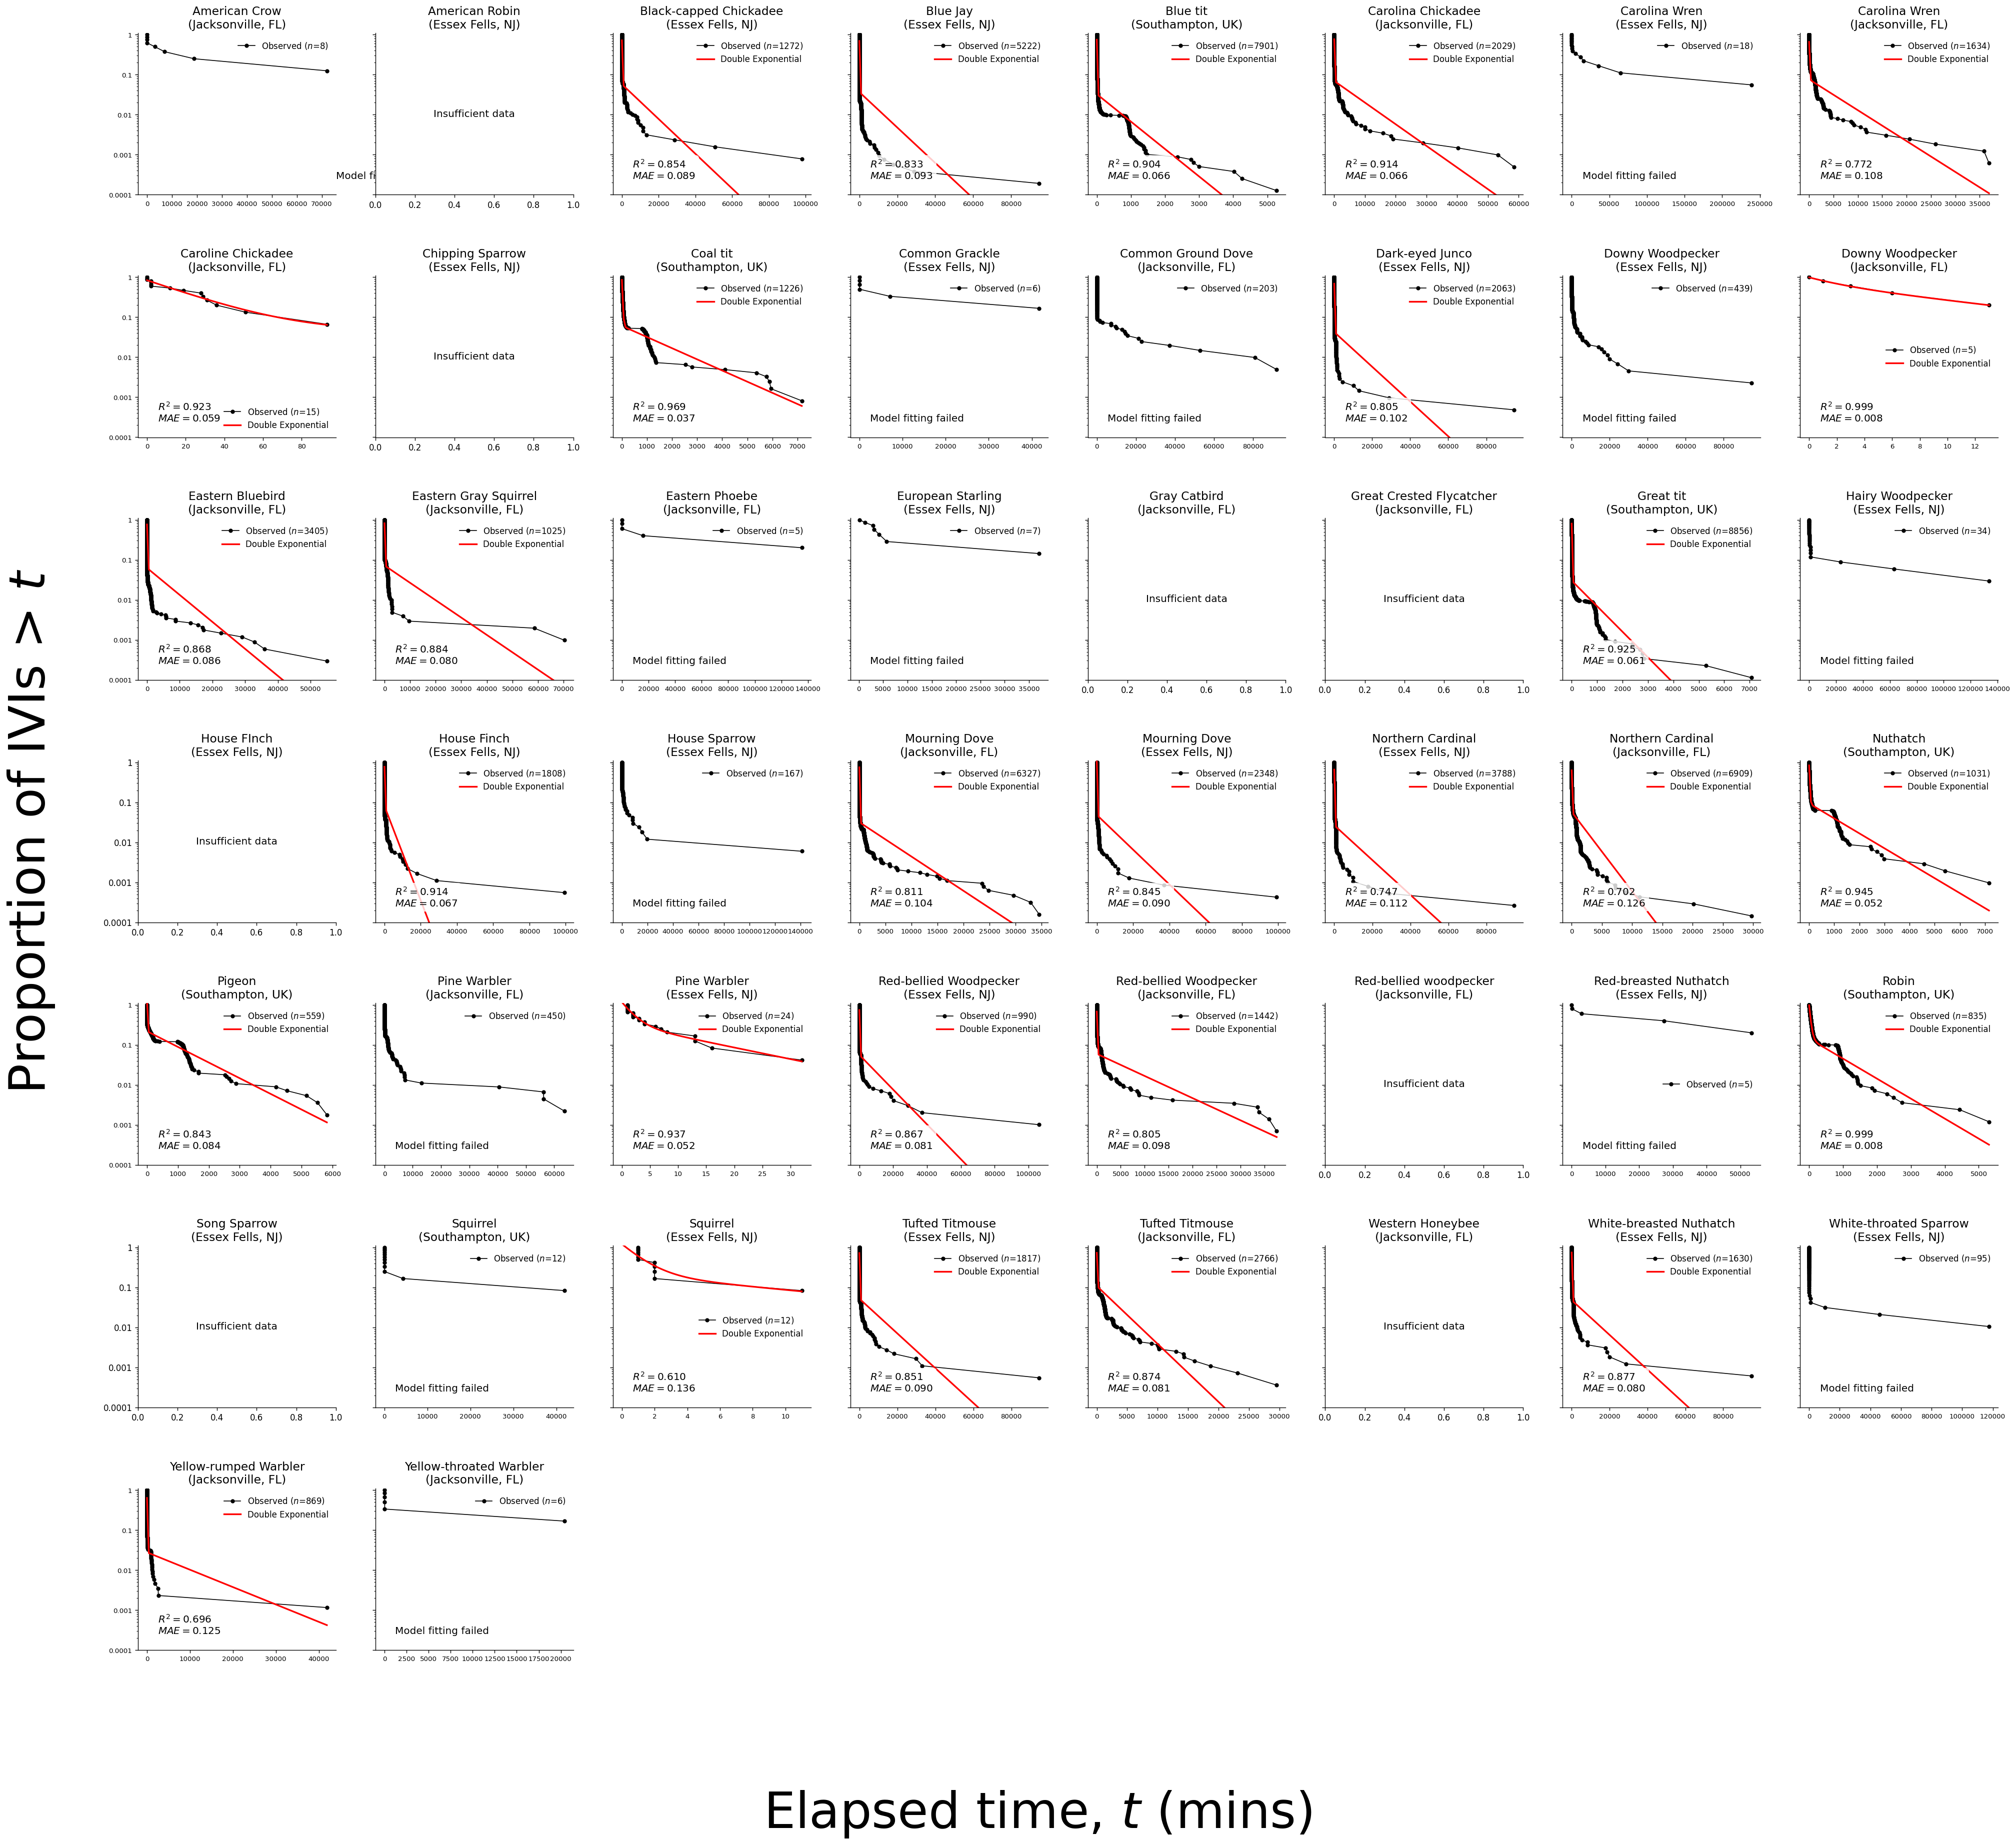
Type: Static Plot
Created: 2026-10-23T15:56:37.079868
Seed Preference by Bird and Feeder Side
(Right Side More Open)
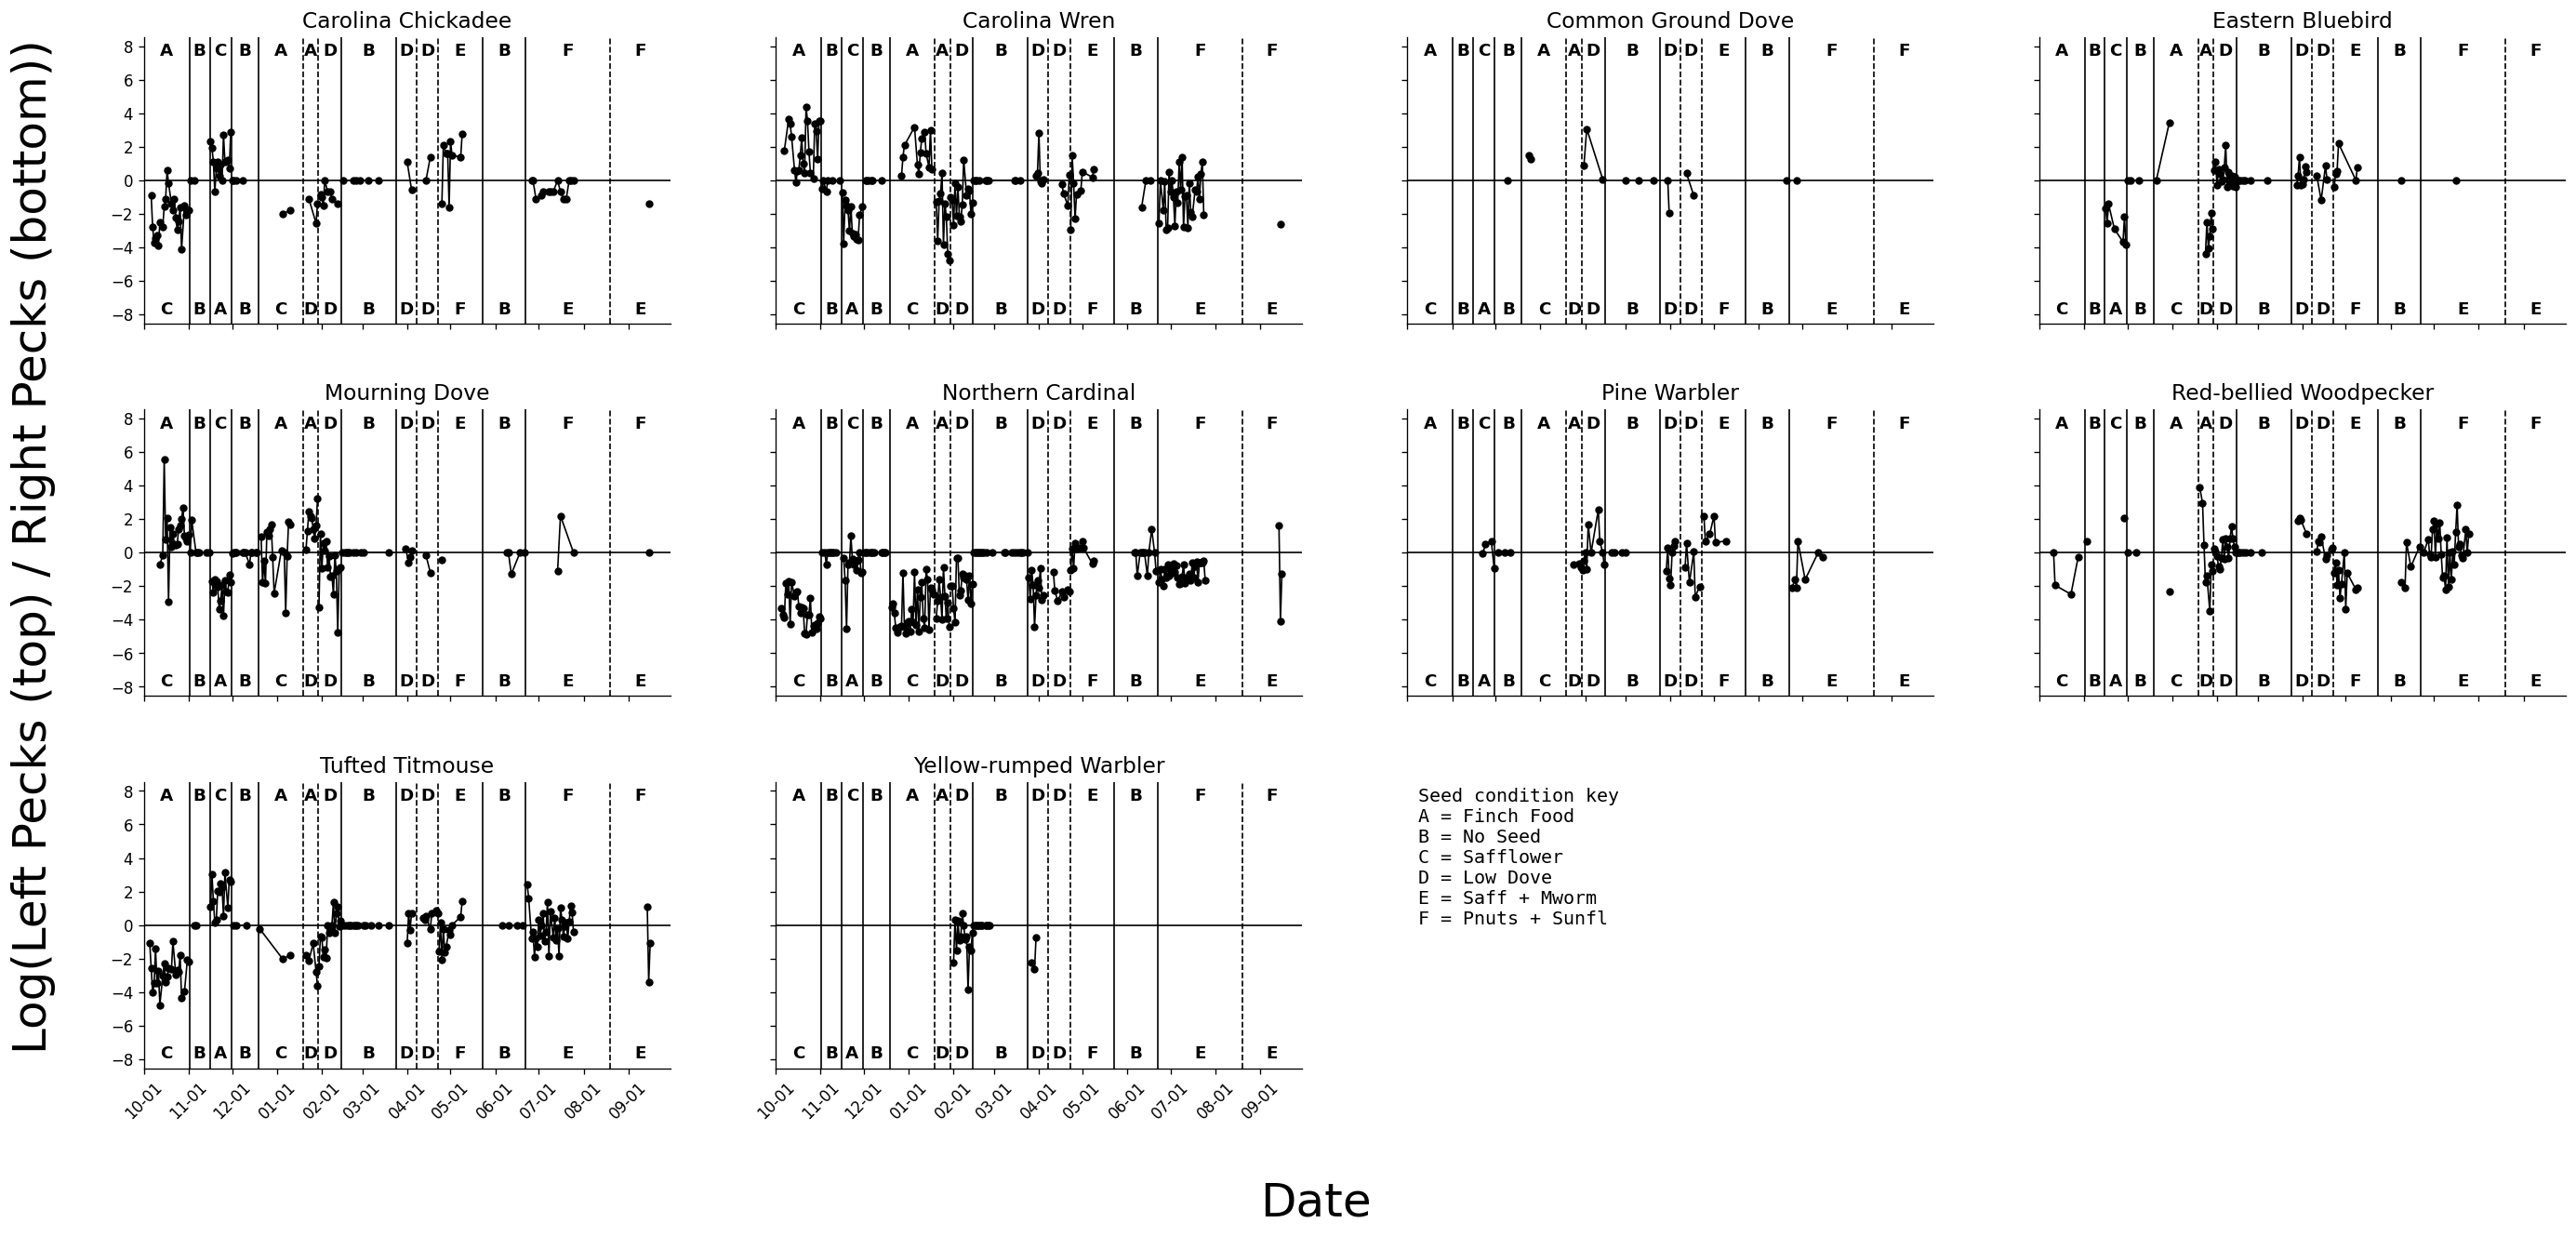
Type: Static Plot
Created: 2026-10-23T15:58:28.976748
Number of Pecks per Visit by Seed Type
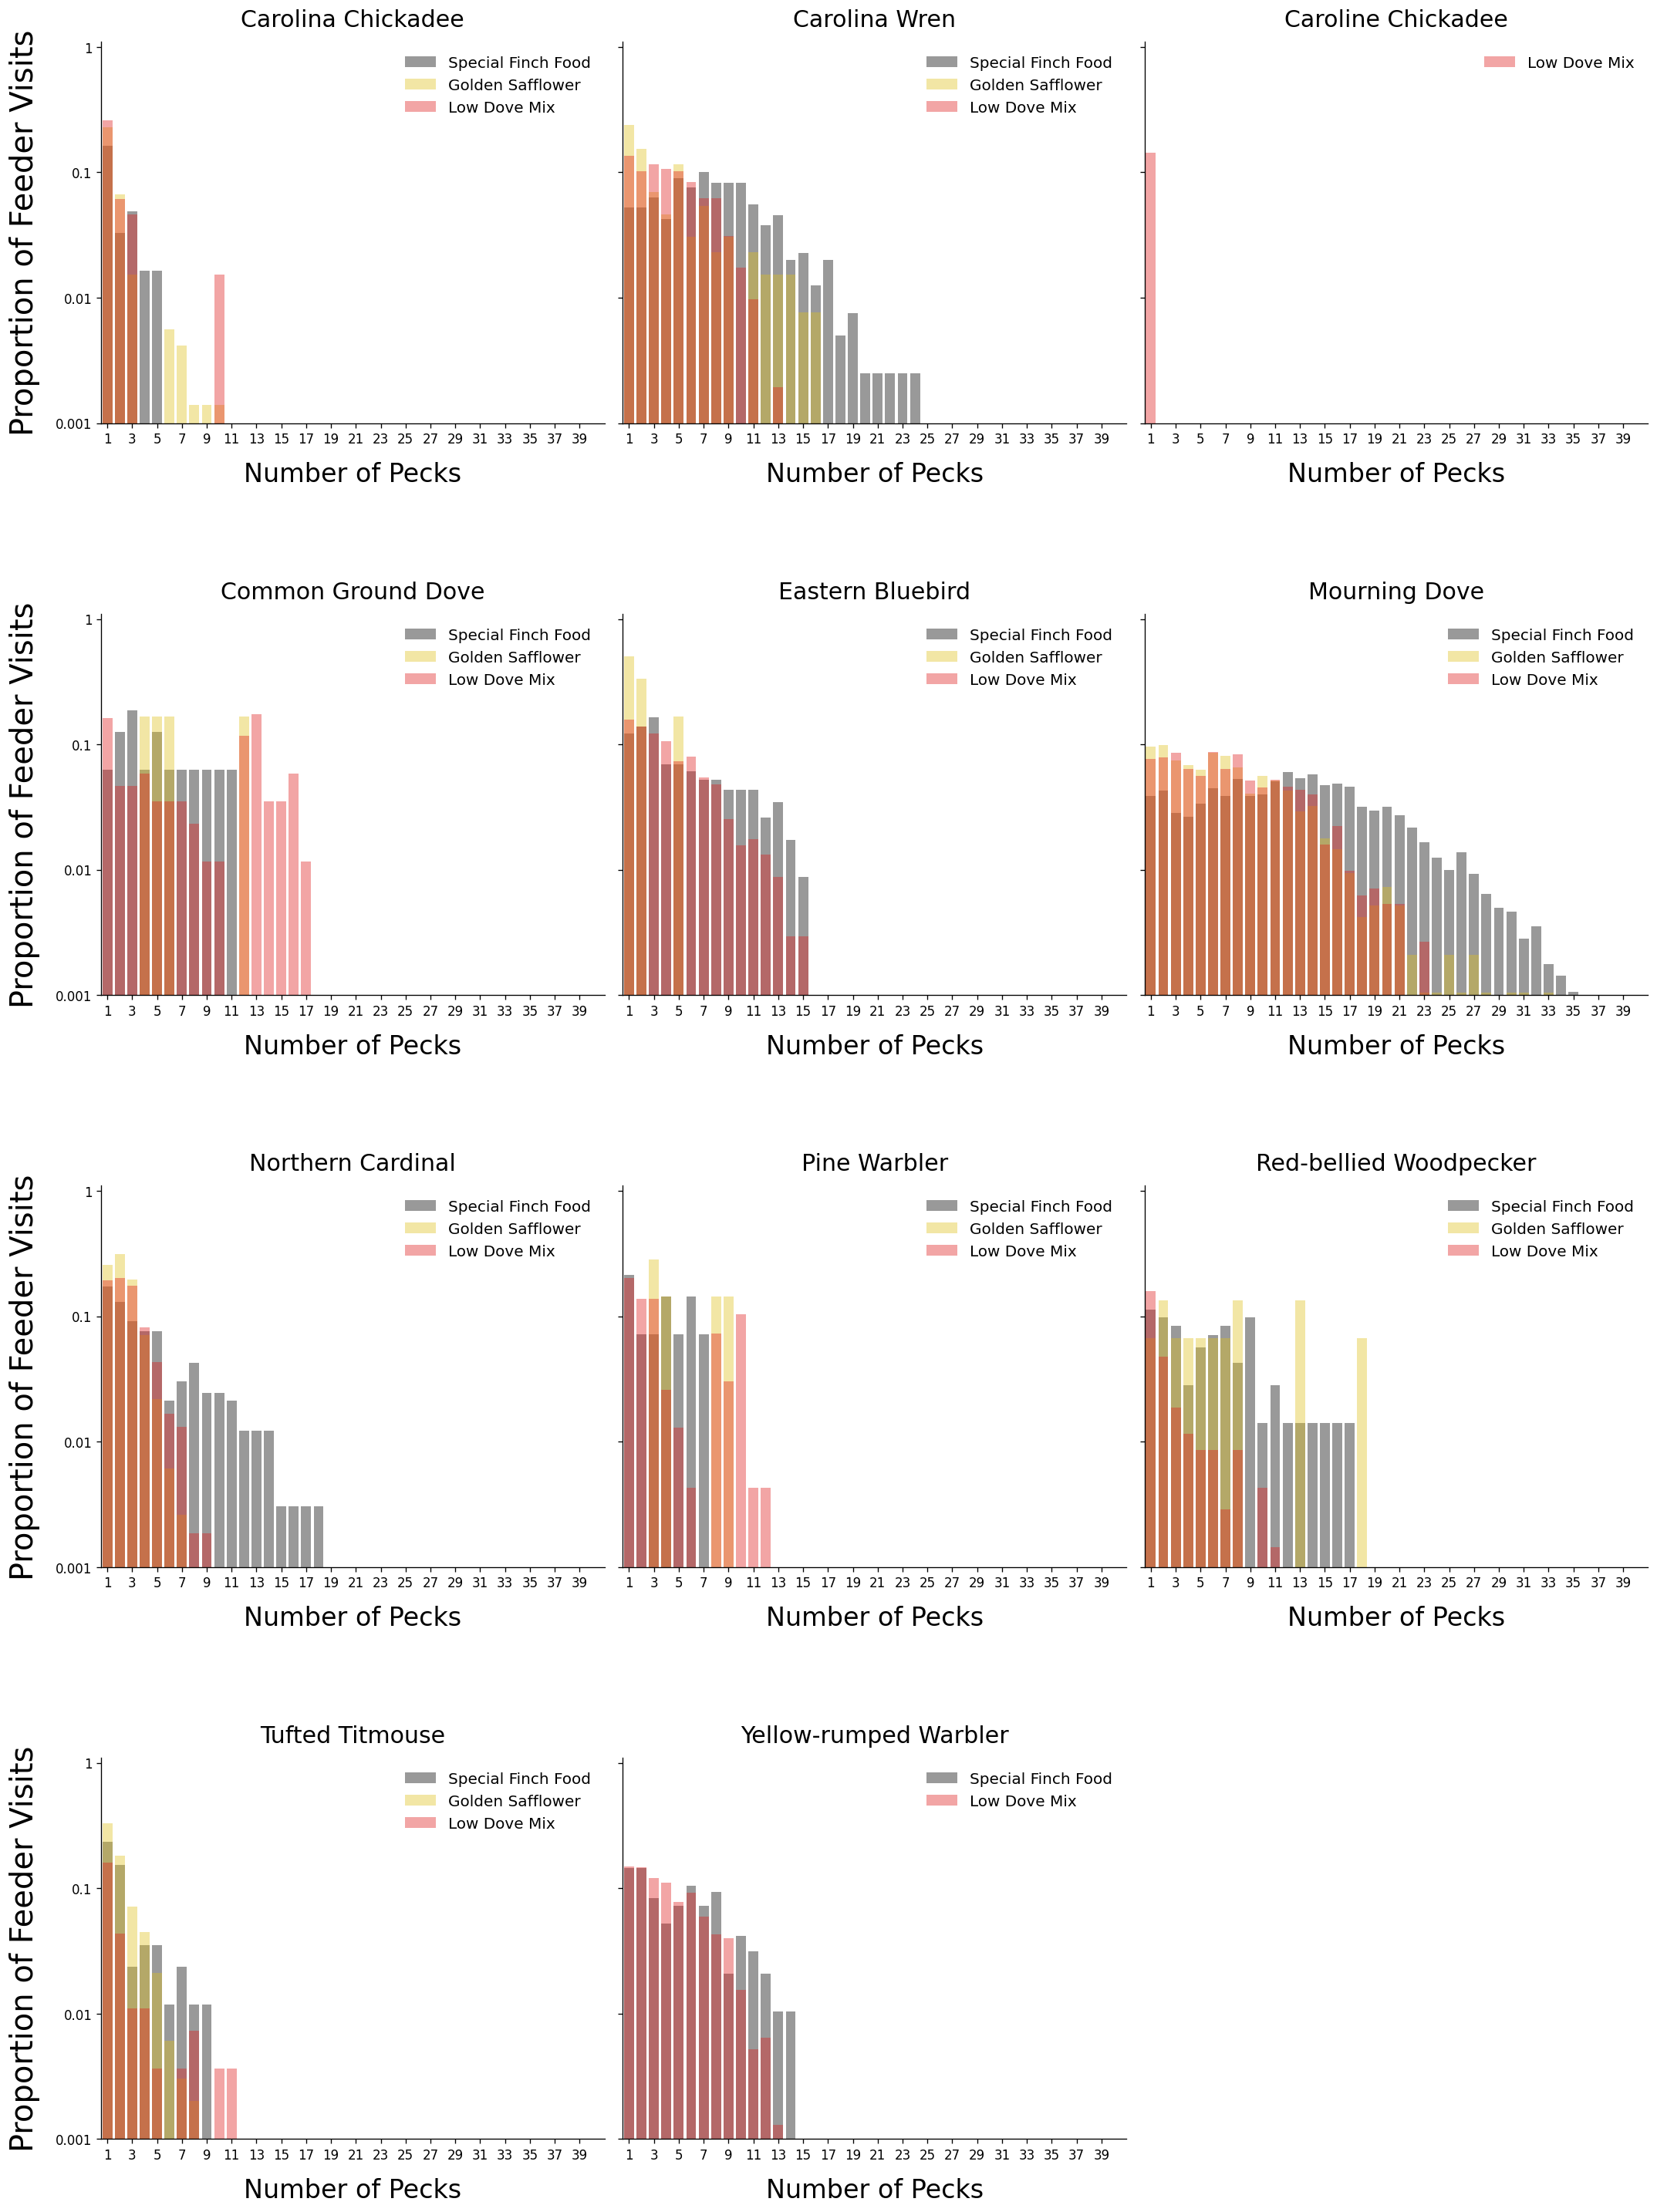
Type: Static Plot
Created: 2026-10-23T15:58:31.108965